CLASS OF 2024
3B
OF
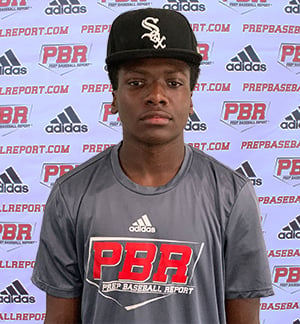
Jonah
Weathers
John A. Logan JC
Marian Catholic (HS) • IL
 6' 3" • 185LBS
R/R • 18yr 11mo
Travel Team: Chicago White Sox Ace
Marian Catholic (HS) • IL
R/R • 18yr 11mo
Travel Team: Chicago White Sox Ace
Rankings
2024 National
Rankings available to Premium Subscriber
2024 State
Rankings available to Premium Subscriber
Commitment
Best Of Stats
26.7
Hand Speed (max)
8/22/20
76.6
Bat Speed (max)
9/04/24
27.1
Rot. Acc (max)
8/08/23
60
Hard Hit %
9/17/22
97.2
Exit Velocity (max)
9/04/24
90.1
Exit Velocity (avg)
9/04/24
346
Distance (max)
8/08/23
73
Sweet Spot %
8/20/21
6.66
60
9/04/24
3.72
30-yd
9/04/24
1.6
10-yd
9/04/24
20.9
Run speed (max)
9/04/24
92
INF Velo
9/04/24
96
OF Velo
9/04/24
-
C Velo
-
Pop Time
Fastball
84
Velocity (max)
7/14/22
79 - 83
Velo Range
9/17/21
2015
Spin Rate (avg)
8/22/20
Changeup
74 - 75
Velo Range
6/23/22
1471
Spin Rate (avg)
8/22/20
Curveball
68 - 73
Velo Range
9/17/21
1880
Spin Rate (avg)
8/22/20
Positional Tools
2024
2023
2022
2021
2020
2019
60 Yard Dash
The athlete's fastest 60-yard dash time in the given event year. Measured in seconds (s)
6.66
Infield Velocity
The athlete's maximum throwing velocity from an infield position in the given event year. Measured in miles per hour (MPH).
92.0
Outfield Velocity
The athlete's maximum throwing velocity from an outfield position in the given event year. Measured in miles per hour (MPH).
96.0
Power / Speed Score
A simple calculation that divides the athlete’s Exit Velocity Max by the athlete’s 60 Yard Dash time for the given event year. For example, 98 MPH / 7.00s = 14.00.
14.6
60 Yard Dash
The athlete's fastest 60-yard dash time in the given event year. Measured in seconds (s)
6.80
Infield Velocity
The athlete's maximum throwing velocity from an infield position in the given event year. Measured in miles per hour (MPH).
87.0
Outfield Velocity
The athlete's maximum throwing velocity from an outfield position in the given event year. Measured in miles per hour (MPH).
90.0
Power / Speed Score
A simple calculation that divides the athlete’s Exit Velocity Max by the athlete’s 60 Yard Dash time for the given event year. For example, 98 MPH / 7.00s = 14.00.
14.0
60 Yard Dash
The athlete's fastest 60-yard dash time in the given event year. Measured in seconds (s)
7.16
Infield Velocity
The athlete's maximum throwing velocity from an infield position in the given event year. Measured in miles per hour (MPH).
87.0
Outfield Velocity
The athlete's maximum throwing velocity from an outfield position in the given event year. Measured in miles per hour (MPH).
88.0
Power / Speed Score
A simple calculation that divides the athlete’s Exit Velocity Max by the athlete’s 60 Yard Dash time for the given event year. For example, 98 MPH / 7.00s = 14.00.
13.2
60 Yard Dash
The athlete's fastest 60-yard dash time in the given event year. Measured in seconds (s)
6.93
Infield Velocity
The athlete's maximum throwing velocity from an infield position in the given event year. Measured in miles per hour (MPH).
85.0
Outfield Velocity
The athlete's maximum throwing velocity from an outfield position in the given event year. Measured in miles per hour (MPH).
86.0
Power / Speed Score
A simple calculation that divides the athlete’s Exit Velocity Max by the athlete’s 60 Yard Dash time for the given event year. For example, 98 MPH / 7.00s = 14.00.
13.0
60 Yard Dash
The athlete's fastest 60-yard dash time in the given event year. Measured in seconds (s)
7.31
Infield Velocity
The athlete's maximum throwing velocity from an infield position in the given event year. Measured in miles per hour (MPH).
80.0
Outfield Velocity
The athlete's maximum throwing velocity from an outfield position in the given event year. Measured in miles per hour (MPH).
82.0
Power / Speed Score
A simple calculation that divides the athlete’s Exit Velocity Max by the athlete’s 60 Yard Dash time for the given event year. For example, 98 MPH / 7.00s = 14.00.
12.1
60 Yard Dash
The athlete's fastest 60-yard dash time in the given event year. Measured in seconds (s)
7.68
Infield Velocity
The athlete's maximum throwing velocity from an infield position in the given event year. Measured in miles per hour (MPH).
69.0
Power / Speed Score
A simple calculation that divides the athlete’s Exit Velocity Max by the athlete’s 60 Yard Dash time for the given event year. For example, 98 MPH / 7.00s = 14.00.
9.8
Hitting

2024
2023
2022
2021
2020
Exit Velocity Max
The highest exit velocity of any batted ball in the given event year. Measured in miles per hour (MPH).
97.2
Exit Velocity Avg
Average exit velocity of all batted balls in the given event year. Measured in miles per hour (MPH).
90.1
Distance Max
The highest flight distance of any batted ball in the given event year. Measured in feet (ft).
328
Distance Avg
Average flight distance of all batted balls in the given event year. Measured in feet (ft).
192
Launch Angle Avg
Average launch angle of all batted balls in the given event year. Measured in degrees.
11.1
Hard Hit %
Percentage of batted balls with exit velocities over 95 MPH in the given event year.
Sweet Spot %
Percentage of batted balls in the given event year with a launch angle between 8° and 32°.
Line Drive %
Percentage of batted balls with launch angles between 10 and 25 degrees in the given event year.
Fly Ball %
Percentage of batted balls with launch angles between 25 and 50 degrees in the given event year.
Ground Ball %
Percentage of batted balls with launch angles below 10 degrees in the given event year.
Exit Velocity Max
The highest exit velocity of any batted ball in the given event year. Measured in miles per hour (MPH).
95.2
Exit Velocity Avg
Average exit velocity of all batted balls in the given event year. Measured in miles per hour (MPH).
83.0
Distance Max
The highest flight distance of any batted ball in the given event year. Measured in feet (ft).
346
Distance Avg
Average flight distance of all batted balls in the given event year. Measured in feet (ft).
237
Launch Angle Avg
Average launch angle of all batted balls in the given event year. Measured in degrees.
26.4
Hard Hit %
Percentage of batted balls with exit velocities over 95 MPH in the given event year.
Sweet Spot %
Percentage of batted balls in the given event year with a launch angle between 8° and 32°.
Line Drive %
Percentage of batted balls with launch angles between 10 and 25 degrees in the given event year.
Fly Ball %
Percentage of batted balls with launch angles between 25 and 50 degrees in the given event year.
Ground Ball %
Percentage of batted balls with launch angles below 10 degrees in the given event year.
Exit Velocity Max
The highest exit velocity of any batted ball in the given event year. Measured in miles per hour (MPH).
94.8
Exit Velocity Avg
Average exit velocity of all batted balls in the given event year. Measured in miles per hour (MPH).
86.9
Distance Max
The highest flight distance of any batted ball in the given event year. Measured in feet (ft).
328
Distance Avg
Average flight distance of all batted balls in the given event year. Measured in feet (ft).
174
Launch Angle Avg
Average launch angle of all batted balls in the given event year. Measured in degrees.
10.6
Hard Hit %
Percentage of batted balls with exit velocities over 95 MPH in the given event year.
Sweet Spot %
Percentage of batted balls in the given event year with a launch angle between 8° and 32°.
Line Drive %
Percentage of batted balls with launch angles between 10 and 25 degrees in the given event year.
Fly Ball %
Percentage of batted balls with launch angles between 25 and 50 degrees in the given event year.
Ground Ball %
Percentage of batted balls with launch angles below 10 degrees in the given event year.
Exit Velocity Max
The highest exit velocity of any batted ball in the given event year. Measured in miles per hour (MPH).
90.0
Exit Velocity Avg
Average exit velocity of all batted balls in the given event year. Measured in miles per hour (MPH).
77.8
Distance Max
The highest flight distance of any batted ball in the given event year. Measured in feet (ft).
292
Distance Avg
Average flight distance of all batted balls in the given event year. Measured in feet (ft).
208
Launch Angle Avg
Average launch angle of all batted balls in the given event year. Measured in degrees.
26.1
Hard Hit %
Percentage of batted balls with exit velocities over 95 MPH in the given event year.
Sweet Spot %
Percentage of batted balls in the given event year with a launch angle between 8° and 32°.
Line Drive %
Percentage of batted balls with launch angles between 10 and 25 degrees in the given event year.
Fly Ball %
Percentage of batted balls with launch angles between 25 and 50 degrees in the given event year.
Ground Ball %
Percentage of batted balls with launch angles below 10 degrees in the given event year.
Exit Velocity Max
The highest exit velocity of any batted ball in the given event year. Measured in miles per hour (MPH).
88.1
Exit Velocity Avg
Average exit velocity of all batted balls in the given event year. Measured in miles per hour (MPH).
82.4
Distance Max
The highest flight distance of any batted ball in the given event year. Measured in feet (ft).
324
Distance Avg
Average flight distance of all batted balls in the given event year. Measured in feet (ft).
185
Launch Angle Avg
Average launch angle of all batted balls in the given event year. Measured in degrees.
16.3
Hard Hit %
Percentage of batted balls with exit velocities over 95 MPH in the given event year.
Sweet Spot %
Percentage of batted balls in the given event year with a launch angle between 8° and 32°.
Line Drive %
Percentage of batted balls with launch angles between 10 and 25 degrees in the given event year.
Fly Ball %
Percentage of batted balls with launch angles between 25 and 50 degrees in the given event year.
Ground Ball %
Percentage of batted balls with launch angles below 10 degrees in the given event year.
PBR IL: John A Logan / SIC / Rend Lake / Kaskaskia Scout Day
Sep 4, 2024
Trackman - Hitting
97.2
Exit Velocity (max)
90.1
Exit Velocity (avg)
192
Distance (avg)
328
Distance (max)
Hard Hit %
Sweet Spot %
Line Drive %
Fly Ball %
Ground Ball %
Illinois State Games (Invite-Only)
Aug 8, 2023
Trackman - Hitting
95.2
Exit Velocity (max)
83.0
Exit Velocity (avg)
237
Distance (avg)
346
Distance (max)
Hard Hit %
Sweet Spot %
Line Drive %
Fly Ball %
Ground Ball %
White Sox ACE Scout Day
Sep 17, 2022
Trackman - Hitting
94.8
Exit Velocity (max)
86.9
Exit Velocity (avg)
174
Distance (avg)
328
Distance (max)
Hard Hit %
Sweet Spot %
Line Drive %
Fly Ball %
Ground Ball %
2022 PBR Future Games
Jul 27, 2022
Trackman - Hitting
89.7
Exit Velocity (max)
84.7
Exit Velocity (avg)
268
Distance (avg)
328
Distance (max)
Sweet Spot %
Line Drive %
Fly Ball %
Ground Ball %
White Sox ACE Scout Day
Aug 20, 2021
Trackman - Hitting
90.0
Exit Velocity (max)
80.8
Exit Velocity (avg)
214
Distance (avg)
292
Distance (max)
Sweet Spot %
Line Drive %
Fly Ball %
Ground Ball %
Underclass Invitational (Invite Only)
Mar 27, 2021
Trackman - Hitting
88.5
Exit Velocity (max)
74.7
Exit Velocity (avg)
202
Distance (avg)
283
Distance (max)
Sweet Spot %
Line Drive %
Fly Ball %
Ground Ball %
2024 Top Prospect Games
Aug 22, 2020
Trackman - Hitting
88.1
Exit Velocity (max)
82.4
Exit Velocity (avg)
185
Distance (avg)
324
Distance (max)
Sweet Spot %
Line Drive %
Fly Ball %
Ground Ball %
Hitting

2024
2023
2022
2021
2020
Hand Speed Max
The highest Peak Hand Speed of any swing in the given event year.
23.7
Hand Speed Avg
The average Peak Hand Speed for all swings in the given event year.
22.9
Bat Speed Max
The highest Bat Speed of any swing in the given event year.
76.6
Bat Speed Avg
The average Bat Speed for all swings in the given event year.
75.0
Rotational Acceleration Max
The highest Rotational Acceleration of any swing in the given event year.
Rotational Acceleration Avg
The average Rotational Acceleration for all swings in the given event year.
On-Plane Efficiency Max
The highest On-Plane Efficiency of any swing in the given event year.
On-Plane Efficiency Avg
The average On-Plane Efficiency for all swings in the given event year.
Hand Speed Max
The highest Peak Hand Speed of any swing in the given event year.
23.8
Hand Speed Avg
The average Peak Hand Speed for all swings in the given event year.
23.3
Bat Speed Max
The highest Bat Speed of any swing in the given event year.
76.5
Bat Speed Avg
The average Bat Speed for all swings in the given event year.
73.1
Rotational Acceleration Max
The highest Rotational Acceleration of any swing in the given event year.
Rotational Acceleration Avg
The average Rotational Acceleration for all swings in the given event year.
On-Plane Efficiency Max
The highest On-Plane Efficiency of any swing in the given event year.
On-Plane Efficiency Avg
The average On-Plane Efficiency for all swings in the given event year.
Hand Speed Max
The highest Peak Hand Speed of any swing in the given event year.
24.4
Hand Speed Avg
The average Peak Hand Speed for all swings in the given event year.
24.4
Bat Speed Max
The highest Bat Speed of any swing in the given event year.
71.8
Bat Speed Avg
The average Bat Speed for all swings in the given event year.
71.8
Rotational Acceleration Max
The highest Rotational Acceleration of any swing in the given event year.
Rotational Acceleration Avg
The average Rotational Acceleration for all swings in the given event year.
On-Plane Efficiency Max
The highest On-Plane Efficiency of any swing in the given event year.
On-Plane Efficiency Avg
The average On-Plane Efficiency for all swings in the given event year.
Hand Speed Max
The highest Peak Hand Speed of any swing in the given event year.
25.0
Hand Speed Avg
The average Peak Hand Speed for all swings in the given event year.
23.3
Bat Speed Max
The highest Bat Speed of any swing in the given event year.
67.9
Bat Speed Avg
The average Bat Speed for all swings in the given event year.
64.8
Rotational Acceleration Max
The highest Rotational Acceleration of any swing in the given event year.
Rotational Acceleration Avg
The average Rotational Acceleration for all swings in the given event year.
On-Plane Efficiency Max
The highest On-Plane Efficiency of any swing in the given event year.
On-Plane Efficiency Avg
The average On-Plane Efficiency for all swings in the given event year.
Hand Speed Max
The highest Peak Hand Speed of any swing in the given event year.
26.7
Hand Speed Avg
The average Peak Hand Speed for all swings in the given event year.
24.2
Bat Speed Max
The highest Bat Speed of any swing in the given event year.
71.9
Bat Speed Avg
The average Bat Speed for all swings in the given event year.
66.1
Rotational Acceleration Max
The highest Rotational Acceleration of any swing in the given event year.
Rotational Acceleration Avg
The average Rotational Acceleration for all swings in the given event year.
On-Plane Efficiency Max
The highest On-Plane Efficiency of any swing in the given event year.
On-Plane Efficiency Avg
The average On-Plane Efficiency for all swings in the given event year.
PBR IL: John A Logan / SIC / Rend Lake / Kaskaskia Scout Day
Sep 4, 2024
Blast - Hitting
23.7
Hand Speed (max)
22.9
Hand Speed (avg)
76.6
Bat Speed (max)
75.0
Bat Speed (avg)
Rot. Acc (max)
Rot. Acc (avg)
On Plane Eff (avg)
MaxOnPlaneEfficiency
Illinois State Games (Invite-Only)
Aug 8, 2023
Blast - Hitting
23.8
Hand Speed (max)
23.3
Hand Speed (avg)
76.5
Bat Speed (max)
73.1
Bat Speed (avg)
Rot. Acc (max)
Rot. Acc (avg)
On Plane Eff (avg)
MaxOnPlaneEfficiency
White Sox ACE Scout Day
Sep 17, 2022
Blast - Hitting
24.4
Hand Speed (max)
24.4
Hand Speed (avg)
71.8
Bat Speed (max)
71.8
Bat Speed (avg)
Rot. Acc (max)
Rot. Acc (avg)
On Plane Eff (avg)
MaxOnPlaneEfficiency
White Sox ACE Scout Day
Aug 20, 2021
Blast - Hitting
25.0
Hand Speed (max)
23.4
Hand Speed (avg)
67.2
Bat Speed (max)
63.8
Bat Speed (avg)
Rot. Acc (max)
Rot. Acc (avg)
On Plane Eff (avg)
MaxOnPlaneEfficiency
Underclass Invitational (Invite Only)
Mar 27, 2021
Blast - Hitting
24.5
Hand Speed (max)
23.2
Hand Speed (avg)
67.9
Bat Speed (max)
65.9
Bat Speed (avg)
Rot. Acc (max)
Rot. Acc (avg)
On Plane Eff (avg)
MaxOnPlaneEfficiency
2024 Top Prospect Games
Aug 22, 2020
Blast - Hitting
26.7
Hand Speed (max)
24.3
Hand Speed (avg)
71.9
Bat Speed (max)
66.1
Bat Speed (avg)
Rot. Acc (max)
Rot. Acc (avg)
On Plane Eff (avg)
MaxOnPlaneEfficiency
Pitching

2020
Fastball
Velocity Max
The maximum observed fastball velocity in the given event year. Measured in miles per hour (MPH).
81.9
Fastball
Velocity Avg
The average velocity for all pitches of this type in the given event year. Measured in miles per hour (MPH).
78.8
Fastball
Spin Rate Avg
The average rate of spin for all pitches of this type in the given event year. Measured in rotations per minute (RPM).
2015
Fastball
Spin Score Avg
The average Bauer Units value of all fastballs in the given event year. Bauer Units are calculated for each pitch by dividing Spin Rate by Velocity.
25.6
Fastball
Total Movement Avg
The average total non-gravity movement for all pitches of this type in the given event year. Measured in inches (in).
Curveball
Velocity Avg
The average velocity for all pitches of this type in the given event year. Measured in miles per hour (MPH).
61.9
Curveball
Spin Rate Avg
The average rate of spin for all pitches of this type in the given event year. Measured in rotations per minute (RPM).
1880
Curveball
Total Movement Avg
The average total non-gravity movement for all pitches of this type in the given event year. Measured in inches (in).
Changeup
Velocity Avg
The average velocity for all pitches of this type in the given event year. Measured in miles per hour (MPH).
66.5
Changeup
Spin Rate Avg
The average rate of spin for all pitches of this type in the given event year. Measured in rotations per minute (RPM).
1471
Changeup
Total Movement Avg
The average total non-gravity movement for all pitches of this type in the given event year. Measured in inches (in).
Knuckleball
Velocity Avg
The average velocity for all pitches of this type in the given event year. Measured in miles per hour (MPH).
62.6
Knuckleball
Total Movement Avg
The average total non-gravity movement for all pitches of this type in the given event year. Measured in inches (in).
2024 Top Prospect Games
Aug 22, 2020
Trackman - Fastball
81.9
Velocity (max)
76.8 - 80.8
Velo Range
76.6
Eff Velocity (avg)
2,102
Spin Rate (max)
2,015
Spin Rate (avg)
IVB (max)
IVB (avg)
HM (max)
HM (avg)
Extension (avg)
Release Ht (avg)
Spin Score (max)
Zone %
Trackman - Curveball
62.7
Velocity (max)
60.7 - 62.7
Velo Range
57.5
Eff Velocity (avg)
1,980
Spin Rate (max)
1,880
Spin Rate (avg)
IVB (max)
IVB (avg)
HM (max)
HM (avg)
Extension (avg)
Release Ht (avg)
Spin Score (max)
Trackman - ChangeUp
67.3
Velocity (max)
65.8 - 67.3
Velo Range
65.4
Eff Velocity (avg)
1,495
Spin Rate (max)
1,471
Spin Rate (avg)
IVB (max)
IVB (avg)
HM (max)
HM (avg)
Extension (avg)
Release Ht (avg)
Spin Score (max)
Trackman - Knuckleball
62.6
Velocity (max)
59.2
Eff Velocity (avg)
IVB (max)
IVB (avg)
HM (max)
HM (avg)
Extension (avg)
Release Ht (avg)
Pitch Scores
Pitching Velos
2023
2022
2021
2020
2019
Fastball
Velocity Max
The maximum observed fastball velocity in the given event year. Measured in miles per hour (MPH).
79.0
Fastball
Velocity Avg
The average velocity for all pitches of this type in the given event year. Measured in miles per hour (MPH)
78.0
Curveball
Velocity Avg
The average velocity for all pitches of this type in the given event year. Measured in miles per hour (MPH)
62.0
Fastball
Velocity Max
The maximum observed fastball velocity in the given event year. Measured in miles per hour (MPH).
84.0
Fastball
Velocity Avg
The average velocity for all pitches of this type in the given event year. Measured in miles per hour (MPH)
80.8
Changeup
Velocity Avg
The average velocity for all pitches of this type in the given event year. Measured in miles per hour (MPH)
74.5
Fastball
Velocity Max
The maximum observed fastball velocity in the given event year. Measured in miles per hour (MPH).
83.0
Fastball
Velocity Avg
The average velocity for all pitches of this type in the given event year. Measured in miles per hour (MPH)
80.0
Curveball
Velocity Avg
The average velocity for all pitches of this type in the given event year. Measured in miles per hour (MPH)
68.2
Fastball
Velocity Max
The maximum observed fastball velocity in the given event year. Measured in miles per hour (MPH).
82.0
Fastball
Velocity Avg
The average velocity for all pitches of this type in the given event year. Measured in miles per hour (MPH)
78.5
Curveball
Velocity Avg
The average velocity for all pitches of this type in the given event year. Measured in miles per hour (MPH)
61.5
Changeup
Velocity Avg
The average velocity for all pitches of this type in the given event year. Measured in miles per hour (MPH)
66.0
Fastball
Velocity Max
The maximum observed fastball velocity in the given event year. Measured in miles per hour (MPH).
65.0
Fastball
Velocity Avg
The average velocity for all pitches of this type in the given event year. Measured in miles per hour (MPH)
61.5
Curveball
Velocity Avg
The average velocity for all pitches of this type in the given event year. Measured in miles per hour (MPH)
52.0
Game Performance

2024
2023
2022
10 Yard Dash
The athlete's fastest 0-10-yard split time in the given event year. Measured in seconds.
1.60
30 Yard Dash
The athlete's fastest 0-30-yard split time in the given event year. Measured in seconds.
3.72
60 Yard Dash
The athlete's fastest 0-60-yard time in the given event year. Measured in seconds.
6.66
Top Speed (MPH)
The athlete's fastest split time converted to miles per hour.
10 Yard Dash
The athlete's fastest 0-10-yard split time in the given event year. Measured in seconds.
1.66
30 Yard Dash
The athlete's fastest 0-30-yard split time in the given event year. Measured in seconds.
3.79
60 Yard Dash
The athlete's fastest 0-60-yard time in the given event year. Measured in seconds.
6.80
Top Speed (MPH)
The athlete's fastest split time converted to miles per hour.
10 Yard Dash
The athlete's fastest 0-10-yard split time in the given event year. Measured in seconds.
1.75
30 Yard Dash
The athlete's fastest 0-30-yard split time in the given event year. Measured in seconds.
4.00
60 Yard Dash
The athlete's fastest 0-60-yard time in the given event year. Measured in seconds.
7.16
Top Speed (MPH)
The athlete's fastest split time converted to miles per hour.
2022 PBR Future Games
Jul 27, 2022
Swift
1.74
10-yd
3.91
30-yd
7.04
60-yd
19.7
Run speed (max)
8.3
Run Speed (avg)
1.85
RSi (max)
1.85
RSi (avg)
1,739
Jump Power (max)
30.4
Jump Height (max)
30.1
Jump Height (avg)
Visual Edge

2023
2022
2021
Edge Score
The highest Edge Score within the given year. Edge Score is a comprehensive score that takes the core-six visual skills into account, providing an assessment of an athlete’s overall visual ability.
68.52
Edge Score
The highest Edge Score within the given year. Edge Score is a comprehensive score that takes the core-six visual skills into account, providing an assessment of an athlete’s overall visual ability.
67.03
Edge Score
The highest Edge Score within the given year. Edge Score is a comprehensive score that takes the core-six visual skills into account, providing an assessment of an athlete’s overall visual ability.
58.52
Pitch Ai

Notes
News
- John A Logan / SIC / Rend Lake / Kaskaskia Scout Day: Takeaways - Oct 4, 2024
- Recruiting Roundup: Week of 11/5 - Nov 13, 2023
- Illinois State Games: 2024 Infielder Analysis - Oct 20, 2023
- Illinois State Games: 2024 Outfielder Analysis - Oct 17, 2023
- Illinois State Games Takeaways: 2024s - Aug 16, 2023
- ACE Scout Day: Takeaways - Oct 3, 2022
- PBR Future Games: Statistical Analysis - Sep 1, 2022
- Future Games: Team Illinois Game 2 Recap - Jul 29, 2022
- PBR Future Games: Team Illinois Preview - Jul 20, 2022
- Illinois Class of 2024 Rankings Update: Uncommitted Follows - May 24, 2022
- Week 6 Games - May 5, 2022
- Best of 2021: Max Infield Velocity Leaders - Jan 21, 2022
- Best of 2021: 60-Yard Dash Leaders - Jan 5, 2022
- Illinois Class of 2024 Rankings: On the Radar - Oct 14, 2021
- Underclass Invitational: Infield Analysis - Jun 3, 2021
- Illinois 2024 Top Prospect Games: Pitcher Analysis - Nov 6, 2020
- Illinois 2024 Top Prospect Games: Infielder Analysis - Nov 5, 2020
- Illinois 2024 Top Prospect Games: Outfield Analysis - Nov 4, 2020
- Future Prospects Showcase - The MAX: Analysis - May 29, 2020
- Future Prospects Showcase - Lockport: Player Analysis - Jun 14, 2019
Comments
Draft Reports
Contact
Premium Content Area
To unlock contact information, you need to purchase a ScoutPLUS subscription.
Purchase Subscription OR
Login
Physical
2023
Grip Strgth (LH)
Grip strength is a measure of a players bat control and ability to transfer power and speed during impact, measured in pounds of force generated; collected with elbow bent at 90 degrees.
Grip Strgth (RH)
Grip strength is a measure of a players bat control and ability to transfer power and speed during impact, measured in pounds of force generated; collected with elbow bent at 90 degrees.











 Sign in to view rankings
Verbally committed to John A. Logan.
UTIL Jonah Weathers (Marian, 2024) is one of the top uncommitted prospects still on the market in Illinois. Currently ranked No. 51 in the state, the former Future Gamer was all over the barrel Saturday, collecting two doubles in our brief look. His swing looks to be a bit more fluid than in years past, loading with more rhythm to help stay on time before firing through the zone with a quick barrel. Showed above-average base-running abilities, reading balls in the dirt and always looking to take the extra base.
Still uncommitted, 3B/OF Jonah Weathers (Marian Catholic, 2024) has noteworthy tools and athleticism attached to a strong, well-proportioned 6-foot-3, 180-pound frame. Weathers, who’s also a standout basketball player at Marian Catholic, showed above-average hand (23.8 mph) and bat speed (76.5 mph) on the workout day to go along with a 95.2 mph max exit velocity and 346 ft. peak distance. He did so from a flat and simple right-handed swing, staying through the baseball to the pull-side while maintaining balance throughout. It didn’t take long for Weathers to show his strength in game, as he rocketed a triple into the right-center gap in his second at-bat of the event. He also ran a 6.80 60 and was 87 mph across the infield with a 90 mph arm from the outfield.
Positional Profile: 3B/OF
Body: 6-3, 180-pounds.
Hit: RHH. Stock setup, leg lift trigger with rhythm. Hands start back, direct bat path, line drives to pull-side. Finished game play 2-for-7 with a double, triple, three RBIs and a run scored. 73.1 mph bat speed with 25 G’s of rotational acceleration.
Power: 95 max exit velocity, averaged 83 mph. 346’ max distance.
Arm: RH. INF - 87 mph. OF - 90 mph. OF: Short, 3/4 slot, some carry at times.
INF: Short, quick, varied arm angles.
Defense: OF: Active footwork, plays through the ball with intent, steady hands.
INF: Athletic two-hand gather, plays through the ball, fluid actions.
Run: 6.80 runner in the 60
UTIL Jonah Weathers (Marian Catholic, 2024) is still one of the top uncommitted prospects in the state of Illinois class of 2024. The 2022 Future Games participant took one of the best rounds of batting practice during the event. Weathers has a simple, quiet, repeatable swing with easy effort and loose, strong hands through the zone. Weathers drove the ball to both gaps with authority and backspin. Defensively, Weathers profiled equally as well in the outfield and the infield. He has active feet and moves with rhythm and tempo in both spots with his arm strength increasing since the last time we saw him; topped at 88 mph from the outfield and 86 mph from the infield. Weathers is a high follow in the class of 2024.
Uncommitted, currently ranked No. 16 in the Illinois 2024 class. Highly projectable and high-waisted frame at 6-foot-2, 165-pounds. Started on the mound for Marian and ran his fastball up to 79 mph. His arm easily translated to the infield, where he showed the ability to backspin the ball over to first with ease, playing with carry and accuracy. Weathers cruised around second base after he was done pitching and impressed with uber-easy and athletic actions, showcasing soft hands with a quick/clean transfer, also playing with easy range to both sides of the glove. The right-handed hitter started in the two-hole for Marian and showcased an easy right-handed swing; long-levered with a flat path to the ball, minimal wasted movement with little perceived effort.
Positional Profile: 3B/RHP
Body: 6-2, 157-pounds.
Hit: RHH. Athletic, balanced setup, short stride, simple pre-pitch actions. Short swing, peak hand speed of 23.2 MPH, gap-to-gap approach, line drives.
Power: 88.47 max exit velocity, averaged 74.73 mph. 282’ max distance.
Arm: RH. INF - 85 mph. Long, quick arm action, high 3/4 arm slot.
Defense: Flashes athletic infield actions, reliable hands, clean exchanges, plays through the ball, body control.
Run: 6.93 runner in the 60. Above average runner.
Positional Profile: 3B/RHP
Body: 6-0, 150-pounds. Long-limbed, athletic build with plenty of room for continued physical development.
Delivery: Stretch-only; level knee lift into deep coil/tuck at balance point, shoulders closed. Works on line, long stride with level shoulders, lands square. Athletic finish, momentum carries him to home.
Arm Action: RH. Short draw, long and clean swing to high 3/4 slot; quick arm speed, looseness.
FB: T82, 78-80 mph. Generates advanced carry through the zone; averaged 19.0 inches of Induced Vertical Break, per TrackMan, with a 22.0-inch high. True four-seam type.
CB: 61-63 mph. 11/5 shape; raw feel for spin, gradual action.
CH: 66-67 mph. Thrown at arm speed, featuring run/fade; matches arm action to increase deception.
Hit: RHH. Wide, spread setup, quiet load and short stride. Compact, repeatable swing, minimal wasted movement. Loose, quick hands, short uphill bat path and pull-side tendencies.
Power: 83 mph exit velocity from the tee. Top hand speed of the event; 26.70 mph, according to Blast. Max distance of 324' with a max exit velocity of 88.14 mph during BP, via TrackMan.
Arm: RH. INF - 80 mph. OF - 82 mph. Quick arm action, plays over the top from the outfield; multiple slots on the infield.
Defense: Worked out in the outfield and on the infield. Currently actions played best in the outfield. Active quick feet, attacks the baseball, gets behind the baseball, steady hands and plays through the baseball.
Run: 7.60 runner in the 60.
Positional Profile: 3B/RHP
Body: 5-11, 140-pounds. Athletic, projectable frame.
Defense: Infield actions, fluid footwork, reliable hands and plays through the baseball.
Arm: RH. INF - 79 mph. Long arm action, over-the-top slot.
Hit: RH. Balanced, slightly crouched setup, minimal load and short stride. Stays on balance throughout, short path, elevates the baseball and works gap-to-gap.
Power: 79 mph exit velocity from the tee.
Run: 7.31 runner in the 60.
Delivery: Deliberate smooth delivery, repeats, stays on-line and lands square.
Arm Action: RH. Clean quick arm action, high 3/4 slot.
FB: T79, 77-79 mph. Clean out of the hand, hard late action, thrown for strikes.
CB: 60-62 mph. 11/5 shape, late action, down in the zone.
CH: 64-67 mph. Maintains arm speed, arm-side-run.
KN: 62-64 mph.
Positional Profile: RHP/3B
Body: 5-foot-8, 133-pounds.
Defense: Clean exchange, works through the baseball.
Arm: RH. INF - 64 mph. Long arm action, high 3/4 slot, accurate arm.
Hit: RHH. Slightly open balanced setup, short stride. Uphill path, loose hands and pull-side approach.
Power: 72 mph exit velocity from the tee.
Run: 8.06 runner in the 60.
Delivery: Tall and fall delivery, level shoulders, in line with target, lands square.
Arm Action: RH. Long arm action, high 3/4 slot.
FB: T65, 59-64 mph. Straight fastball, showed control.
CB: 51-53 mph. 11/5 shape.