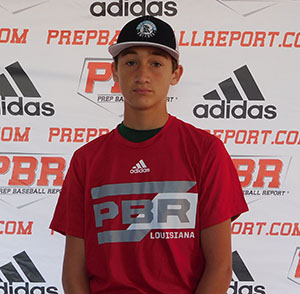
CLASS OF 2024
RHP
SS
Grant
Breaux
Louisiana-Lafayette
Catholic (BR) (HS) • LA
6' 2" • 170LBS
R/R • 19yr 5mo
Travel Team: Knights Knation 16U National
Catholic (BR) (HS) • LA
6' 2" • 170LBS
R/R • 19yr 5mo
Travel Team: Knights Knation 16U National
Rankings
2024 National
Rankings available to Premium Subscriber
2024 State
Rankings available to Premium Subscriber
Commitment
Best Of Stats
Fastball
88
Velocity (max)
7/28/21
84.5 - 87.7
Velo Range
10/30/21
2426
Spin Rate (avg)
10/30/21
Changeup
77 - 78
Velo Range
10/30/21
1705
Spin Rate (avg)
1/09/21
Curveball
75 - 76
Velo Range
10/30/21
2226
Spin Rate (avg)
6/02/21
89.9
Exit Velocity (max)
10/30/21
83.8
Exit Velocity (avg)
11/07/20
293
Distance (max)
6/02/21
67
Sweet Spot %
10/30/21
22.6
Hand Speed (max)
6/02/21
67.4
Bat Speed (max)
10/30/21
8.1
Rot. Acc (max)
6/02/21
-
Hard Hit %
7.09
60
6/02/21
-
30-yd
-
10-yd
-
Run speed (max)
87
INF Velo
6/02/21
89
OF Velo
10/30/21
-
C Velo
-
Pop Time
Positional Tools
2021
2020
2019
60 Yard Dash
The athlete's fastest 60-yard dash time in the given event year. Measured in seconds (s)
7.09
Infield Velocity
The athlete's maximum throwing velocity from an infield position in the given event year. Measured in miles per hour (MPH).
87.0
Outfield Velocity
The athlete's maximum throwing velocity from an outfield position in the given event year. Measured in miles per hour (MPH).
89.0
Power / Speed Score
A simple calculation that divides the athlete’s Exit Velocity Max by the athlete’s 60 Yard Dash time for the given event year. For example, 98 MPH / 7.00s = 14.00.
12.7
60 Yard Dash
The athlete's fastest 60-yard dash time in the given event year. Measured in seconds (s)
7.41
Infield Velocity
The athlete's maximum throwing velocity from an infield position in the given event year. Measured in miles per hour (MPH).
83.0
Power / Speed Score
A simple calculation that divides the athlete’s Exit Velocity Max by the athlete’s 60 Yard Dash time for the given event year. For example, 98 MPH / 7.00s = 14.00.
11.6
60 Yard Dash
The athlete's fastest 60-yard dash time in the given event year. Measured in seconds (s)
7.82
Infield Velocity
The athlete's maximum throwing velocity from an infield position in the given event year. Measured in miles per hour (MPH).
74.0
Power / Speed Score
A simple calculation that divides the athlete’s Exit Velocity Max by the athlete’s 60 Yard Dash time for the given event year. For example, 98 MPH / 7.00s = 14.00.
9.0
Hitting

2021
2020
Exit Velocity Max
The highest exit velocity of any batted ball in the given event year. Measured in miles per hour (MPH).
89.9
Exit Velocity Avg
Average exit velocity of all batted balls in the given event year. Measured in miles per hour (MPH).
79.1
Distance Max
The highest flight distance of any batted ball in the given event year. Measured in feet (ft).
293
Distance Avg
Average flight distance of all batted balls in the given event year. Measured in feet (ft).
184
Launch Angle Avg
Average launch angle of all batted balls in the given event year. Measured in degrees.
18.5
Hard Hit %
Percentage of batted balls with exit velocities over 95 MPH in the given event year.
Sweet Spot %
Percentage of batted balls in the given event year with a launch angle between 8° and 32°.
Line Drive %
Percentage of batted balls with launch angles between 10 and 25 degrees in the given event year.
Fly Ball %
Percentage of batted balls with launch angles between 25 and 50 degrees in the given event year.
Ground Ball %
Percentage of batted balls with launch angles below 10 degrees in the given event year.
Exit Velocity Max
The highest exit velocity of any batted ball in the given event year. Measured in miles per hour (MPH).
86.0
Exit Velocity Avg
Average exit velocity of all batted balls in the given event year. Measured in miles per hour (MPH).
83.8
Distance Max
The highest flight distance of any batted ball in the given event year. Measured in feet (ft).
249
Distance Avg
Average flight distance of all batted balls in the given event year. Measured in feet (ft).
199
Launch Angle Avg
Average launch angle of all batted balls in the given event year. Measured in degrees.
14.0
Hard Hit %
Percentage of batted balls with exit velocities over 95 MPH in the given event year.
Sweet Spot %
Percentage of batted balls in the given event year with a launch angle between 8° and 32°.
Line Drive %
Percentage of batted balls with launch angles between 10 and 25 degrees in the given event year.
Fly Ball %
Percentage of batted balls with launch angles between 25 and 50 degrees in the given event year.
Ground Ball %
Percentage of batted balls with launch angles below 10 degrees in the given event year.
2021 Louisiana All-State Games
Oct 30, 2021
Trackman - Hitting
89.9
Exit Velocity (max)
81.3
Exit Velocity (avg)
169
Distance (avg)
272
Distance (max)
Sweet Spot %
Line Drive %
Fly Ball %
Ground Ball %
2021 Top Prospect Games (Invite-Only)
Jun 2, 2021
Trackman - Hitting
88.5
Exit Velocity (max)
78.1
Exit Velocity (avg)
207
Distance (avg)
293
Distance (max)
Sweet Spot %
Line Drive %
Fly Ball %
Ground Ball %
Louisiana Preseason I.D.
Jan 9, 2021
Trackman - Hitting
85.4
Exit Velocity (max)
73.8
Exit Velocity (avg)
146
Distance (avg)
182
Distance (max)
Fly Ball %
Ground Ball %
Louisiana All-State Games (Invite-Only)
Nov 7, 2020
Trackman - Hitting
86.0
Exit Velocity (max)
83.8
Exit Velocity (avg)
199
Distance (avg)
249
Distance (max)
Sweet Spot %
Line Drive %
Ground Ball %
Hitting

2021
Hand Speed Max
The highest Peak Hand Speed of any swing in the given event year.
22.6
Hand Speed Avg
The average Peak Hand Speed for all swings in the given event year.
20.1
Bat Speed Max
The highest Bat Speed of any swing in the given event year.
67.4
Bat Speed Avg
The average Bat Speed for all swings in the given event year.
65.3
Rotational Acceleration Max
The highest Rotational Acceleration of any swing in the given event year.
Rotational Acceleration Avg
The average Rotational Acceleration for all swings in the given event year.
On-Plane Efficiency Max
The highest On-Plane Efficiency of any swing in the given event year.
On-Plane Efficiency Avg
The average On-Plane Efficiency for all swings in the given event year.
2021 Louisiana All-State Games
Oct 30, 2021
Blast - Hitting
21.9
Hand Speed (max)
20.5
Hand Speed (avg)
67.4
Bat Speed (max)
65.5
Bat Speed (avg)
Rot. Acc (max)
Rot. Acc (avg)
On Plane Eff (avg)
MaxOnPlaneEfficiency
2021 Top Prospect Games (Invite-Only)
Jun 2, 2021
Blast - Hitting
22.6
Hand Speed (max)
19.6
Hand Speed (avg)
66.9
Bat Speed (max)
65.1
Bat Speed (avg)
Rot. Acc (max)
Rot. Acc (avg)
On Plane Eff (avg)
MaxOnPlaneEfficiency
Pitching

2021
Fastball
Velocity Max
The maximum observed fastball velocity in the given event year. Measured in miles per hour (MPH).
87.9
Fastball
Velocity Avg
The average velocity for all pitches of this type in the given event year. Measured in miles per hour (MPH).
85.5
Fastball
Spin Rate Avg
The average rate of spin for all pitches of this type in the given event year. Measured in rotations per minute (RPM).
2354
Fastball
Spin Score Avg
The average Bauer Units value of all fastballs in the given event year. Bauer Units are calculated for each pitch by dividing Spin Rate by Velocity.
27.5
Fastball
Total Movement Avg
The average total non-gravity movement for all pitches of this type in the given event year. Measured in inches (in).
Curveball
Velocity Avg
The average velocity for all pitches of this type in the given event year. Measured in miles per hour (MPH).
62.9
Curveball
Spin Rate Avg
The average rate of spin for all pitches of this type in the given event year. Measured in rotations per minute (RPM).
1972
Curveball
Total Movement Avg
The average total non-gravity movement for all pitches of this type in the given event year. Measured in inches (in).
Changeup
Velocity Avg
The average velocity for all pitches of this type in the given event year. Measured in miles per hour (MPH).
72.6
Changeup
Spin Rate Avg
The average rate of spin for all pitches of this type in the given event year. Measured in rotations per minute (RPM).
1529
Changeup
Total Movement Avg
The average total non-gravity movement for all pitches of this type in the given event year. Measured in inches (in).
2021 Louisiana All-State Games
Oct 30, 2021
Trackman - Fastball
87.7
Velocity (max)
84.5 - 87.7
Velo Range
84.1
Eff Velocity (avg)
2,552
Spin Rate (max)
2,426
Spin Rate (avg)
IVB (max)
IVB (avg)
HM (max)
HM (avg)
Extension (avg)
Release Ht (avg)
Spin Score (max)
Zone %
Trackman - ChangeUp
77.7
Velocity (max)
74.7
Eff Velocity (avg)
1,540
Spin Rate (max)
1,540
Spin Rate (avg)
Extension (avg)
Release Ht (avg)
Spin Score (max)
2021 Future Games
Jul 28, 2021
Trackman - Fastball
87.8
Velocity (max)
83.0 - 86.4
Velo Range
81.5
Eff Velocity (avg)
2,427
Spin Rate (max)
2,177
Spin Rate (avg)
Spin Score (max)
Trackman - Curveball
68.9
Velocity (max)
67.8 - 68.9
Velo Range
66.0
Eff Velocity (avg)
2,308
Spin Rate (max)
2,253
Spin Rate (avg)
Spin Score (max)
Trackman - Slider
69.7
Velocity (max)
66.8 - 69.2
Velo Range
65.3
Eff Velocity (avg)
2,361
Spin Rate (max)
2,121
Spin Rate (avg)
Spin Score (max)
Trackman - ChangeUp
73.0
Velocity (max)
70.8 - 72.8
Velo Range
68.9
Eff Velocity (avg)
1,524
Spin Rate (max)
1,389
Spin Rate (avg)
Spin Score (max)
2021 Top Prospect Games (Invite-Only)
Jun 2, 2021
Trackman - Fastball
87.9
Velocity (max)
86.0 - 87.5
Velo Range
85.7
Eff Velocity (avg)
2,436
Spin Rate (max)
2,350
Spin Rate (avg)
IVB (max)
IVB (avg)
HM (max)
HM (avg)
Extension (avg)
Release Ht (avg)
Spin Score (max)
Zone %
Trackman - Curveball
66.8
Velocity (max)
64.1
Eff Velocity (avg)
2,226
Spin Rate (max)
2,226
Spin Rate (avg)
Extension (avg)
Release Ht (avg)
Spin Score (max)
Trackman - ChangeUp
75.7
Velocity (max)
74.2 - 75.7
Velo Range
73.6
Eff Velocity (avg)
1,394
Spin Rate (max)
1,346
Spin Rate (avg)
IVB (max)
IVB (avg)
HM (max)
HM (avg)
Extension (avg)
Release Ht (avg)
Spin Score (max)
Zone %
Louisiana Preseason I.D.
Jan 9, 2021
Trackman - Fastball
80.9
Velocity (max)
80.0 - 80.9
Velo Range
77.5
Eff Velocity (avg)
2,180
Spin Rate (max)
2,162
Spin Rate (avg)
IVB (max)
IVB (avg)
HM (max)
HM (avg)
Extension (avg)
Release Ht (avg)
Spin Score (max)
Zone %
Trackman - Curveball
61.3
Velocity (max)
60.4 - 61.3
Velo Range
59.1
Eff Velocity (avg)
1,882
Spin Rate (max)
1,844
Spin Rate (avg)
IVB (max)
IVB (avg)
HM (max)
HM (avg)
Extension (avg)
Release Ht (avg)
Spin Score (max)
Trackman - ChangeUp
68.1
Velocity (max)
67.3 - 68.1
Velo Range
66.6
Eff Velocity (avg)
1,788
Spin Rate (max)
1,705
Spin Rate (avg)
IVB (max)
IVB (avg)
HM (max)
HM (avg)
Extension (avg)
Release Ht (avg)
Spin Score (max)
Zone %
Pitch Scores
2021
Fastball
Hop+
A fastball with hop has a flat approach angle and visually jumps through the zone. When thrown up in the zone, it is more likely to generate a higher swing and miss average. Hop+ of 100 is MLB average.
Fastball
Sink+
A fastball with sink has low backspin and drops through the strike zone. When thrown down in the zone, it is more likely to generate a higher ground ball percentage and lower launch angle. Sink+ of 100 is MLB average.
Fastball
Rise+
A fastball with rise has a high percentage of backspin. When thrown up in the zone, it is more likely to generate a higher fly ball percentage. Rise+ of 100 is MLB average
Pitching Velos
2021
2020
Fastball
Velocity Max
The maximum observed fastball velocity in the given event year. Measured in miles per hour (MPH).
88.0
Fastball
Velocity Avg
The average velocity for all pitches of this type in the given event year. Measured in miles per hour (MPH)
84.3
Curveball
Velocity Avg
The average velocity for all pitches of this type in the given event year. Measured in miles per hour (MPH)
68.0
Changeup
Velocity Avg
The average velocity for all pitches of this type in the given event year. Measured in miles per hour (MPH)
73.2
Fastball
Velocity Max
The maximum observed fastball velocity in the given event year. Measured in miles per hour (MPH).
80.0
Fastball
Velocity Avg
The average velocity for all pitches of this type in the given event year. Measured in miles per hour (MPH)
77.0
Curveball
Velocity Avg
The average velocity for all pitches of this type in the given event year. Measured in miles per hour (MPH)
64.8
Changeup
Velocity Avg
The average velocity for all pitches of this type in the given event year. Measured in miles per hour (MPH)
61.5
Game Performance

Visual Edge

Pitch Ai

2021
Arm Speed
The maximum speed, in the direction of home plate, that the wrist is traveling. Measured in meters per second (m/s)
Knee Extension Velo
The angular velocity of the front knee straightening after foot plant, which provides indicators of velocity potential. Measured in degrees per second.
Deception
The amount of time that the ball is visible to the hitter, after the instant of front foot strike. Measures in milliseconds.
Hip-Shoulder Separation
The difference in angle of between the hips and shoulders, occurring close to the foot plant. Measured in degrees.
2021 Future Games
Jul 28, 2021
ProPlayAI - Foot Plant
Elbow Flexion (avg)
Shoulder Abduction (avg)
Hip Shoulder Seperation (avg)
ProPlayAI - MER
External Rotation (avg)
Stride Length (avg)
Horizontal Abduction (avg)
ProPlayAI - Release
Arm Speed (max)
Arm Speed (avg)
Knee Extension Velocity (max)
Knee Extension Velocity (avg)
Knee Flexion (avg)
Lateral Trunk Tilt (avg)
Arm Path (avg)
Deception (avg)
Torque (avg)
Efficiency (avg)
Sequencing (avg)
Notes
News
- 2024 Team Preview: Catholic BR High School - Jan 9, 2024
- 2023 Team Preview: Catholic (BR) High School - Jan 31, 2023
- 2022 Team Preview - Catholic Baton Rouge - Jan 22, 2022
- Most Viewed Profiles (2021) - #5 Grant Breaux - Dec 26, 2021
- 2024 Rankings: Regional Breakdown (SOUTH) - Oct 7, 2021
- Louisiana Rankings Update - 2024 Class - Sep 16, 2021
- Commitment Spotlight - 2024 Grant Breaux - Sep 4, 2021
- PBR Louisiana Future Games - Pitchers Analysis - Aug 8, 2021
- 2021 Future Games: College Commitment Tracker - Aug 3, 2021
- PBR Louisiana Future Games - "Meet the Team" - Jul 23, 2021
- Top Pitchers Coming To Future Games - Jul 21, 2021
- Louisiana Top Prospect Games - Quick Hits - Jun 3, 2021
- All-State Games: Infielder Analysis - Jan 20, 2021
Comments
Draft Reports
Contact
Premium Content Area
To unlock contact information, you need to purchase a ScoutPLUS subscription.
Purchase Subscription OR
Login


 Sign in to view rankings
Positional Profile: 3B
Body: Athletic, lean, and wiry 6’1” 160 lbs. frame with plenty of room to add strength.
Hit: Starts in an athletic stance with some weight preloaded in the back hip. Hands held right at shoulder height with good rhythm. Did a good job of staying behind the baseball and on his backside as he drove the bat head to contact with slightly uphill extension, showing present gap to gap power.
Power: Max exit velocity of 89 mph.
Arm: High ¾ release. Long, loose, and whippy arm action.
Defense: Minimal movements on the dirt. Positioned body early, presenting the glove out front. Took a little long to release the ball at times. Profiles as a corner INF.
Run: Posted a 7.09 in the 60.
Positional Profile: RHP. Starter profile.
Delivery: Starts on left side of rubber and stays there. Athletic delivery. Brings the ball down out of the glove with a long arm circle, releasing the ball from a high ¾ arm slot.
Arm Action: High 3/4. Long and loose arm action with minimal effort.
FB: 86-88 mph with arm side run at times. Avg. spin of 2350 RPM, Max spin of 2436 RPM
CB: 67-69 mph, “11-5” shape. Avg. spin of 2226 RPM
CH: 74-76 mph with some sink.
Projectable and athletic 6’1” 160 lbs. frame with plenty of room to add strength. Two-way prospect, former Junior Future Gamer who just pitched at this event wanting to make up from November’s All-State Games. Future starter profile with an athletic delivery. Loose and easy arm action, releasing the ball from a ¾ arm slot produced a max FB velocity of 81 mph, sitting 79-80 mph, albeit, on a colder day. FB stayed true with good life in the zone with an average of 2162 RPM. CB was “10-4” in shape, sitting 60-61 mph. The spin and bite of the pitch will improve with added strength. 67-68 mph CH was a good secondary offering with late arm side fade. A high follow in the 2024 class.
Projectable 5-foot-10, 140-pound frame. In the box, the right-handed hitter had a max exit velocity of 70 mph. Begins in an open stance, has a wrapping load and uses a small leg kick before his swing. Displays above average bat speed, as well as an uphill swing plane and extension on his finish. Found some barrels through his round. Gap to gap approach. In the infield, made throws across the field up to 74 mph; has developing footwork and soft hands. Showed a loose arm action and a ¾ slot. He recorded a 60 time of 7.82 at the event.