CLASS OF 2024
SS
3B
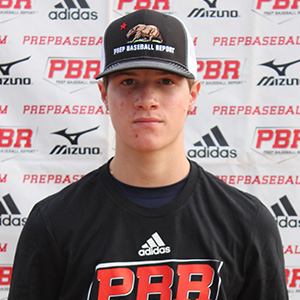
Jake
Downing
Cal Poly
Serra (HS) • CA
5' 10" • 175LBS
L/R • 19yr 2mo
Travel Team: Game Prep Baseball Academy
Serra (HS) • CA
5' 10" • 175LBS
L/R • 19yr 2mo
Travel Team: Game Prep Baseball Academy
Rankings
2024 National
Rankings available to Premium Subscriber
2024 State
Rankings available to Premium Subscriber
Commitment
Best Of Stats
24.1
Hand Speed (max)
7/27/22
76.1
Bat Speed (max)
7/27/22
20.4
Rot. Acc (max)
7/27/22
75
Hard Hit %
6/04/23
95.9
Exit Velocity (max)
6/10/22
90.8
Exit Velocity (avg)
6/10/22
364
Distance (max)
6/04/23
81
Sweet Spot %
6/04/23
6.85
60
6/04/23
3.81
30-yd
6/04/23
1.64
10-yd
6/04/23
20.2
Run speed (max)
6/04/23
86
INF Velo
8/02/22
-
OF Velo
-
C Velo
-
Pop Time
Positional Tools
2023
2022
2021
2020
Infield Velocity
The athlete's maximum throwing velocity from an infield position in the given event year. Measured in miles per hour (MPH).
80.0
60 Yard Dash
The athlete's fastest 60-yard dash time in the given event year. Measured in seconds (s)
6.89
Infield Velocity
The athlete's maximum throwing velocity from an infield position in the given event year. Measured in miles per hour (MPH).
85.0
Power / Speed Score
A simple calculation that divides the athlete’s Exit Velocity Max by the athlete’s 60 Yard Dash time for the given event year. For example, 98 MPH / 7.00s = 14.00.
13.9
60 Yard Dash
The athlete's fastest 60-yard dash time in the given event year. Measured in seconds (s)
6.99
Infield Velocity
The athlete's maximum throwing velocity from an infield position in the given event year. Measured in miles per hour (MPH).
77.0
Power / Speed Score
A simple calculation that divides the athlete’s Exit Velocity Max by the athlete’s 60 Yard Dash time for the given event year. For example, 98 MPH / 7.00s = 14.00.
13.5
60 Yard Dash
The athlete's fastest 60-yard dash time in the given event year. Measured in seconds (s)
7.39
Infield Velocity
The athlete's maximum throwing velocity from an infield position in the given event year. Measured in miles per hour (MPH).
72.0
Power / Speed Score
A simple calculation that divides the athlete’s Exit Velocity Max by the athlete’s 60 Yard Dash time for the given event year. For example, 98 MPH / 7.00s = 14.00.
10.9
Hitting

2023
2022
2021
2020
Exit Velocity Max
The highest exit velocity of any batted ball in the given event year. Measured in miles per hour (MPH).
94.2
Exit Velocity Avg
Average exit velocity of all batted balls in the given event year. Measured in miles per hour (MPH).
90.2
Distance Max
The highest flight distance of any batted ball in the given event year. Measured in feet (ft).
364
Distance Avg
Average flight distance of all batted balls in the given event year. Measured in feet (ft).
260
Launch Angle Avg
Average launch angle of all batted balls in the given event year. Measured in degrees.
20.7
Hard Hit %
Percentage of batted balls with exit velocities over 95 MPH in the given event year.
Sweet Spot %
Percentage of batted balls in the given event year with a launch angle between 8° and 32°.
Line Drive %
Percentage of batted balls with launch angles between 10 and 25 degrees in the given event year.
Fly Ball %
Percentage of batted balls with launch angles between 25 and 50 degrees in the given event year.
Ground Ball %
Percentage of batted balls with launch angles below 10 degrees in the given event year.
Exit Velocity Max
The highest exit velocity of any batted ball in the given event year. Measured in miles per hour (MPH).
95.9
Exit Velocity Avg
Average exit velocity of all batted balls in the given event year. Measured in miles per hour (MPH).
90.8
Distance Max
The highest flight distance of any batted ball in the given event year. Measured in feet (ft).
343
Distance Avg
Average flight distance of all batted balls in the given event year. Measured in feet (ft).
228
Launch Angle Avg
Average launch angle of all batted balls in the given event year. Measured in degrees.
20.1
Hard Hit %
Percentage of batted balls with exit velocities over 95 MPH in the given event year.
Sweet Spot %
Percentage of batted balls in the given event year with a launch angle between 8° and 32°.
Line Drive %
Percentage of batted balls with launch angles between 10 and 25 degrees in the given event year.
Fly Ball %
Percentage of batted balls with launch angles between 25 and 50 degrees in the given event year.
Ground Ball %
Percentage of batted balls with launch angles below 10 degrees in the given event year.
Exit Velocity Max
The highest exit velocity of any batted ball in the given event year. Measured in miles per hour (MPH).
94.4
Exit Velocity Avg
Average exit velocity of all batted balls in the given event year. Measured in miles per hour (MPH).
85.0
Distance Max
The highest flight distance of any batted ball in the given event year. Measured in feet (ft).
355
Distance Avg
Average flight distance of all batted balls in the given event year. Measured in feet (ft).
270
Launch Angle Avg
Average launch angle of all batted balls in the given event year. Measured in degrees.
43.1
Hard Hit %
Percentage of batted balls with exit velocities over 95 MPH in the given event year.
Sweet Spot %
Percentage of batted balls in the given event year with a launch angle between 8° and 32°.
Line Drive %
Percentage of batted balls with launch angles between 10 and 25 degrees in the given event year.
Fly Ball %
Percentage of batted balls with launch angles between 25 and 50 degrees in the given event year.
Ground Ball %
Percentage of batted balls with launch angles below 10 degrees in the given event year.
Exit Velocity Max
The highest exit velocity of any batted ball in the given event year. Measured in miles per hour (MPH).
80.7
Exit Velocity Avg
Average exit velocity of all batted balls in the given event year. Measured in miles per hour (MPH).
76.1
Distance Max
The highest flight distance of any batted ball in the given event year. Measured in feet (ft).
279
Distance Avg
Average flight distance of all batted balls in the given event year. Measured in feet (ft).
225
Launch Angle Avg
Average launch angle of all batted balls in the given event year. Measured in degrees.
26.4
Hard Hit %
Percentage of batted balls with exit velocities over 95 MPH in the given event year.
Sweet Spot %
Percentage of batted balls in the given event year with a launch angle between 8° and 32°.
Line Drive %
Percentage of batted balls with launch angles between 10 and 25 degrees in the given event year.
Fly Ball %
Percentage of batted balls with launch angles between 25 and 50 degrees in the given event year.
Ground Ball %
Percentage of batted balls with launch angles below 10 degrees in the given event year.
NorCal ProCase
Jun 4, 2023
Trackman - Hitting
94.2
Exit Velocity (max)
90.2
Exit Velocity (avg)
260
Distance (avg)
364
Distance (max)
Hard Hit %
Sweet Spot %
Line Drive %
Fly Ball %
Ground Ball %
2022 PBR Future Games
Jul 27, 2022
Trackman - Hitting
87.4
Exit Velocity (max)
78.8
Exit Velocity (avg)
235
Distance (avg)
313
Distance (max)
Sweet Spot %
Fly Ball %
Ground Ball %
BAWS 2022
Jun 10, 2022
Trackman - Hitting
95.9
Exit Velocity (max)
90.8
Exit Velocity (avg)
260
Distance (avg)
343
Distance (max)
Hard Hit %
Sweet Spot %
Line Drive %
Fly Ball %
Ground Ball %
Peninsula/South Bay Preseason ID
Jan 30, 2022
Trackman - Hitting
94.5
Exit Velocity (max)
90.7
Exit Velocity (avg)
193
Distance (avg)
342
Distance (max)
Hard Hit %
Sweet Spot %
Line Drive %
Fly Ball %
Ground Ball %
NorCal Underclass Games (Invite Only)
Sep 18, 2021
Trackman - Hitting
94.4
Exit Velocity (max)
85.0
Exit Velocity (avg)
270
Distance (avg)
355
Distance (max)
Hard Hit %
Sweet Spot %
Line Drive %
Fly Ball %
Norcal Under & Upperclass ID Showcase
Oct 10, 2020
Trackman - Hitting
80.7
Exit Velocity (max)
76.1
Exit Velocity (avg)
225
Distance (avg)
279
Distance (max)
Sweet Spot %
Line Drive %
Fly Ball %
Ground Ball %
Hitting

2023
2022
2021
Hand Speed Max
The highest Peak Hand Speed of any swing in the given event year.
21.9
Hand Speed Avg
The average Peak Hand Speed for all swings in the given event year.
20.7
Bat Speed Max
The highest Bat Speed of any swing in the given event year.
67.3
Bat Speed Avg
The average Bat Speed for all swings in the given event year.
65.0
Rotational Acceleration Max
The highest Rotational Acceleration of any swing in the given event year.
Rotational Acceleration Avg
The average Rotational Acceleration for all swings in the given event year.
On-Plane Efficiency Max
The highest On-Plane Efficiency of any swing in the given event year.
On-Plane Efficiency Avg
The average On-Plane Efficiency for all swings in the given event year.
Hand Speed Max
The highest Peak Hand Speed of any swing in the given event year.
24.1
Hand Speed Avg
The average Peak Hand Speed for all swings in the given event year.
20.9
Bat Speed Max
The highest Bat Speed of any swing in the given event year.
76.1
Bat Speed Avg
The average Bat Speed for all swings in the given event year.
68.3
Rotational Acceleration Max
The highest Rotational Acceleration of any swing in the given event year.
Rotational Acceleration Avg
The average Rotational Acceleration for all swings in the given event year.
On-Plane Efficiency Max
The highest On-Plane Efficiency of any swing in the given event year.
On-Plane Efficiency Avg
The average On-Plane Efficiency for all swings in the given event year.
Hand Speed Max
The highest Peak Hand Speed of any swing in the given event year.
22.8
Hand Speed Avg
The average Peak Hand Speed for all swings in the given event year.
22.4
Bat Speed Max
The highest Bat Speed of any swing in the given event year.
68.5
Bat Speed Avg
The average Bat Speed for all swings in the given event year.
67.1
Rotational Acceleration Max
The highest Rotational Acceleration of any swing in the given event year.
Rotational Acceleration Avg
The average Rotational Acceleration for all swings in the given event year.
On-Plane Efficiency Max
The highest On-Plane Efficiency of any swing in the given event year.
On-Plane Efficiency Avg
The average On-Plane Efficiency for all swings in the given event year.
NorCal ProCase
Jun 4, 2023
Blast - Hitting
21.9
Hand Speed (max)
20.7
Hand Speed (avg)
67.3
Bat Speed (max)
65.1
Bat Speed (avg)
Rot. Acc (max)
Rot. Acc (avg)
On Plane Eff (avg)
MaxOnPlaneEfficiency
2022 PBR Future Games
Jul 27, 2022
Blast - Hitting
24.1
Hand Speed (max)
22.1
Hand Speed (avg)
76.1
Bat Speed (max)
70.4
Bat Speed (avg)
Rot. Acc (max)
Rot. Acc (avg)
On Plane Eff (avg)
MaxOnPlaneEfficiency
Peninsula/South Bay Preseason ID
Jan 30, 2022
Blast - Hitting
20.6
Hand Speed (max)
19.8
Hand Speed (avg)
70.2
Bat Speed (max)
66.2
Bat Speed (avg)
Rot. Acc (max)
Rot. Acc (avg)
On Plane Eff (avg)
MaxOnPlaneEfficiency
NorCal Underclass Games (Invite Only)
Sep 18, 2021
Blast - Hitting
22.8
Hand Speed (max)
22.4
Hand Speed (avg)
68.5
Bat Speed (max)
67.1
Bat Speed (avg)
Rot. Acc (max)
Rot. Acc (avg)
On Plane Eff (avg)
MaxOnPlaneEfficiency
Pitching

Pitch Scores
Pitching Velos
Game Performance

2023
10 Yard Dash
The athlete's fastest 0-10-yard split time in the given event year. Measured in seconds.
1.64
30 Yard Dash
The athlete's fastest 0-30-yard split time in the given event year. Measured in seconds.
3.81
60 Yard Dash
The athlete's fastest 0-60-yard time in the given event year. Measured in seconds.
6.85
Top Speed (MPH)
The athlete's fastest split time converted to miles per hour.
2022 PBR Future Games
Jul 27, 2022
Swift
1.78
10-yd
3.97
30-yd
7.09
60-yd
19.7
Run speed (max)
8.5
Run Speed (avg)
2.70
RSi (max)
2.70
RSi (avg)
1,415
Jump Power (max)
28.2
Jump Height (max)
28.1
Jump Height (avg)
Visual Edge

2022
Edge Score
The highest Edge Score within the given year. Edge Score is a comprehensive score that takes the core-six visual skills into account, providing an assessment of an athlete’s overall visual ability.
73.06
Pitch Ai

Notes
News
- NorCal Player of the Week: Jake Downing - Mar 14, 2023
- 2022 Preseason ID Events: A Look Back - Nov 9, 2022
- PBR Future Games: Game 3 Standouts - Jul 31, 2022
- Bay Area World Series 2022: TrackMan Hitting Leaderboard - Jul 8, 2022
- Bay Area World Series 2022: Stat Leaders - Jul 6, 2022
- Peninsula/South Bay Preseason ID: MIF Reports - Feb 18, 2022
- Peninsula/South Bay Preseason ID: Blast Leaderboard - Feb 4, 2022
- Peninsula/South Bay Preseason ID: Stat Leaders - Feb 2, 2022
- Peninsula/South Bay Preseason ID: Quick Hits - Feb 1, 2022
- Norcal Underclass Games: MIF Reports - Oct 7, 2021
- Norcal Underclass Games: Blast Motion Leaderboard - Sep 27, 2021
- Norcal Underclass Games: Quick Hits - Sep 27, 2021
- Norcal Underclass Games: Stats Leaders - Sep 23, 2021
- Norcal Underclass ID: Infielder Analysis - Nov 10, 2020
Comments
Draft Reports
Contact
Premium Content Area
To unlock contact information, you need to purchase a ScoutPLUS subscription.
Purchase Subscription OR
Login

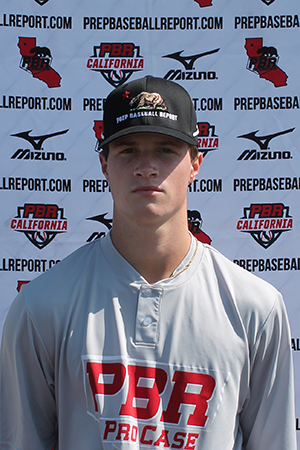

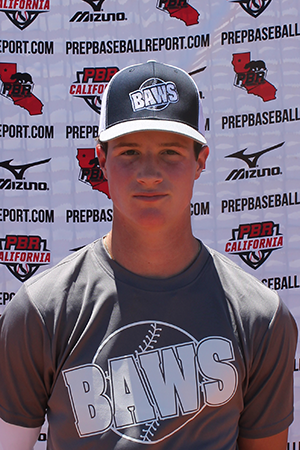
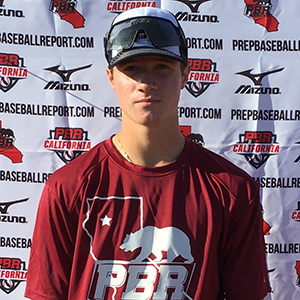
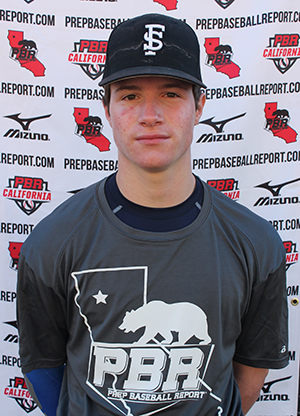


 Sign in to view rankings
ACG Tryout - Smaller, wiry frame. Ball-playerish. Hits, fields, and runs at a high level. Slightly open stance with knees bent and hands held high. Used the LCF gap well for a left handed hitter. Trusts his hands defensively and has a quick transfer. Ran a 7.01 second 60 yard dash and threw 82 mph across the diamond.
Event: NorCal ProCase
Positional Profile: SS/OF
Physical: 5-10, 175 pounds
Offensively: LH. EV max – 94.2 mph, hand speed max – 21.9 mph, bat speed max – 67.3 mph; Pre-pitch moving of both feet in an offset stance and slight movement in the hands to add rhythm. Slight bend in the knees. 2-hand follow-through with a swing angle to generate line drives or fly balls.
Defensively: INF Velo – 80; Gains ground towards target with footwork before and after receiving the ball. A quicker release could be desired.
Bay Area World Series 2022 - Uncommitted; One of top 2024 LHH MIFs in California, lean wiry athlete body type, not particularly big but has some electricity in his body, ran 6.89 in 60-yd, posted 81 mph SS throw in workout, hit-getting ability to all fields as well as ability to put the ball in a gap or down a line and flashes future HR pop, keeps barrel through ball and controls zone in positive counts and can defend tough pitches while hitting mistakes in negative counts, 96 max EV at BAWS with 50% hard hit % (% of balls hit over 90 mph), arm action versatility would something to continue to work on and working to push up the raw arm strength as well, will have multiple opportunities to commit prior to his senior year, likely much earlier.
Positional Profile: SS
Physical: 5-10, 150-pounds; Lean, athletic build. 7.24 runner in the 60.
Offensively: LHH. Open setup, with feet shoulder width apart; upright bat position. Loads straight back with a gliding stride for timing. Slides weight forward pre-contact. while showing an aggressive lower half. Showed a slight lift to the ball with a finish around the back. More line drives than fly balls and ground balls with a peak exit velocity of 95 MPH via Trackman. Heavy sweet spot% (77.8) and when staying in the middle and oppo gap there was a lot of barrel contact, lively swing with some sneaky power potential.
Defensively: Starts with a balanced setup; uses prep hop while displaying fluid actions to the baseball. Hands are out in front with a clean transfer. Moderate arm circle from a standard 3/4 arm slot. SS - 81 MPH. Keeps ball off his body, trusts glove hand, arm action has some length, displays arm strength that projects well for the SS position, playmaker up the middle.
Positional Profile: SS/3B - Ranked #57 in California (#499 nationally), #17 SS in the state.
Body: 5-10, 150-pounds. Present strength with some muscularity on a lean and athletic body type, well-proportioned.
Hit: LHH. Deep in the box, open stance with medium width feet, lead shoulder tucked a bit, gets over back foot as lead leg lifts back before aggressive stride, creates separation and stretch that unleashes with violent intent. Has aggressiveness, powerful through contact with attack angle to produce fly ball launch angle, confidence oozes from him at the plate, has present day loft power to the pull side with additional ability to cut down swing in two strike counts and move the ball with authority to the opposite field, impact bat talent.
Power: 94 max exit velocity, 68.5 max bat speed, 22.8 max hand speed.
Arm: RH. INF - 77 mph. Loose arm, quick flick after getting out of deeper longer arm stroke, athletic thrower, gets air under the throws to create enough carry for left side.
Defense: Technically sound, played the balls in workout with smoothness and calmness, game play showed more urgency as a playmaker, light feet with good body control, soft hands with confident actions.
Run: 6.99 runner in the 60.
vs FBK1 15U at PBR West Coast Championships - Lean athletic body, starting SS, L/R, showed all field hit ability, line drive stroke with ability to drive ball over RF head, runs above average, lateral range and strong arm both showed up at SS, went to backhand well, showed himself to be an impact talent in the 2024 class.
Positional Profile: 2B/SS
Body: 5-9, 140-pounds. Athletic, smaller build, room and time to fill out.
Hit: LHH. Open stance with large weight shift and load, upward barrel path.
Power: Topped 81 MPH Exit Velo via Trackman in BP, power will come with lean mass + size.
Arm: RH. INF - 72 mph. Shorter arm action in the INF that topped out at 72 MPH during the defensive workout.
Defense: Quality footwork in the INF, moved with some quickness, may need to improve urgency at next level.
Run: 7.39 runner in the 60.