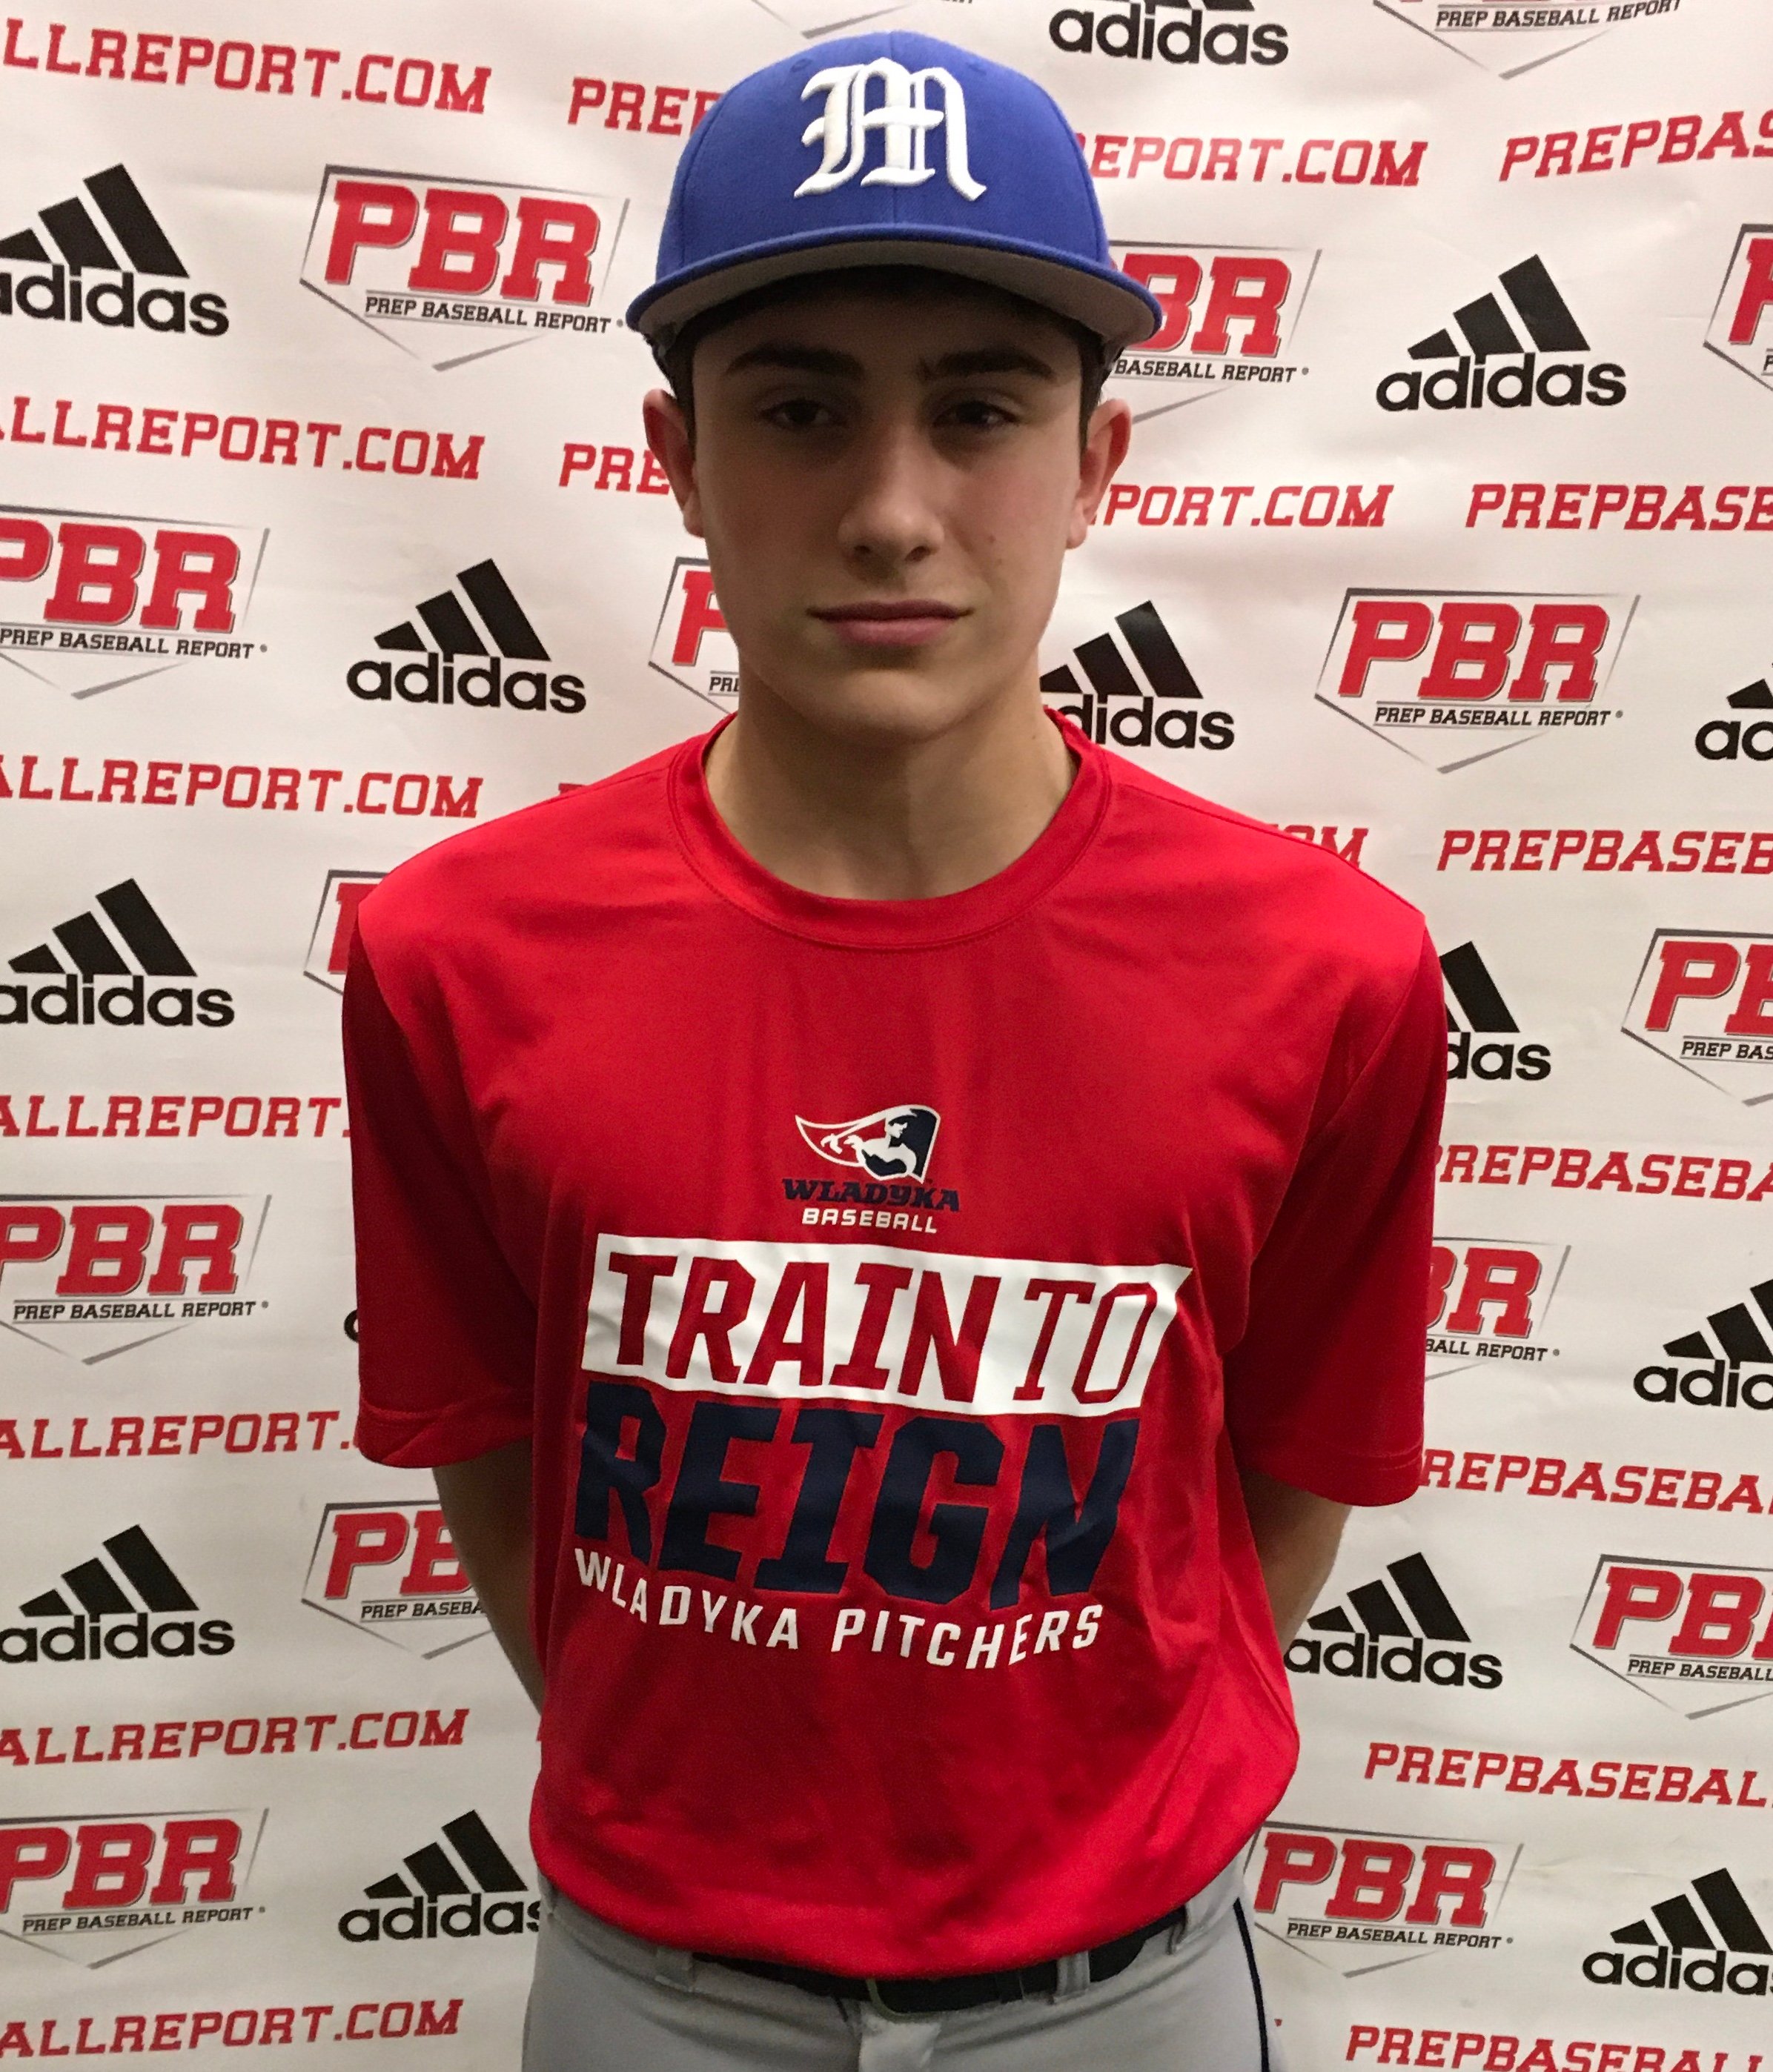
CLASS OF 2023
RHP
OF
Steven
Echavarria
Florida
Millburn (HS) • NJ
6' 2" • 180LBS
R/R • 19yr 3mo
Travel Team: Wladyka-Millburn
Millburn (HS) • NJ
6' 2" • 180LBS
R/R • 19yr 3mo
Travel Team: Wladyka-Millburn
Rankings
2023 National
Rankings available to Premium Subscriber
2023 State
Rankings available to Premium Subscriber
Commitment
Best Of Stats
Fastball
97
Velocity (max)
4/05/23
93 - 96
Velo Range
4/05/23
2260
Spin Rate (avg)
7/05/20
Changeup
77 - 82
Velo Range
3/07/21
1869
Spin Rate (avg)
3/07/21
Curveball
70 - 72
Velo Range
3/07/21
2152
Spin Rate (avg)
8/02/20
Slider
81 - 83
Velo Range
4/05/23
-
Spin Rate (avg)
85.1
Exit Velocity (max)
7/05/20
71.9
Exit Velocity (avg)
7/05/20
287
Distance (max)
7/05/20
57
Sweet Spot %
7/05/20
7.11
60
7/05/20
-
30-yd
-
10-yd
-
Run speed (max)
-
INF Velo
83
OF Velo
7/05/20
-
C Velo
-
Pop Time
Positional Tools
2020
60 Yard Dash
The athlete's fastest 60-yard dash time in the given event year. Measured in seconds (s)
7.11
Outfield Velocity
The athlete's maximum throwing velocity from an outfield position in the given event year. Measured in miles per hour (MPH).
83.0
Power / Speed Score
A simple calculation that divides the athlete’s Exit Velocity Max by the athlete’s 60 Yard Dash time for the given event year. For example, 98 MPH / 7.00s = 14.00.
12.0
Hitting

2020
Exit Velocity Max
The highest exit velocity of any batted ball in the given event year. Measured in miles per hour (MPH).
85.1
Exit Velocity Avg
Average exit velocity of all batted balls in the given event year. Measured in miles per hour (MPH).
71.9
Distance Max
The highest flight distance of any batted ball in the given event year. Measured in feet (ft).
287
Distance Avg
Average flight distance of all batted balls in the given event year. Measured in feet (ft).
190
Launch Angle Avg
Average launch angle of all batted balls in the given event year. Measured in degrees.
25.1
Hard Hit %
Percentage of batted balls with exit velocities over 95 MPH in the given event year.
Sweet Spot %
Percentage of batted balls in the given event year with a launch angle between 8° and 32°.
Line Drive %
Percentage of batted balls with launch angles between 10 and 25 degrees in the given event year.
Fly Ball %
Percentage of batted balls with launch angles between 25 and 50 degrees in the given event year.
Ground Ball %
Percentage of batted balls with launch angles below 10 degrees in the given event year.
2020 NJ Future Games Select (Session I)
Jul 5, 2020
Trackman - Hitting
85.1
Exit Velocity (max)
71.9
Exit Velocity (avg)
190
Distance (avg)
287
Distance (max)
Sweet Spot %
Line Drive %
Fly Ball %
Ground Ball %
Hitting

Pitching

2021
2020
Fastball
Velocity Max
The maximum observed fastball velocity in the given event year. Measured in miles per hour (MPH).
88.2
Fastball
Velocity Avg
The average velocity for all pitches of this type in the given event year. Measured in miles per hour (MPH).
87.3
Fastball
Spin Rate Avg
The average rate of spin for all pitches of this type in the given event year. Measured in rotations per minute (RPM).
1973
Fastball
Spin Score Avg
The average Bauer Units value of all fastballs in the given event year. Bauer Units are calculated for each pitch by dividing Spin Rate by Velocity.
22.6
Fastball
Total Movement Avg
The average total non-gravity movement for all pitches of this type in the given event year. Measured in inches (in).
Curveball
Velocity Avg
The average velocity for all pitches of this type in the given event year. Measured in miles per hour (MPH).
70.9
Curveball
Spin Rate Avg
The average rate of spin for all pitches of this type in the given event year. Measured in rotations per minute (RPM).
2123
Curveball
Total Movement Avg
The average total non-gravity movement for all pitches of this type in the given event year. Measured in inches (in).
Changeup
Velocity Avg
The average velocity for all pitches of this type in the given event year. Measured in miles per hour (MPH).
79.6
Changeup
Spin Rate Avg
The average rate of spin for all pitches of this type in the given event year. Measured in rotations per minute (RPM).
1869
Changeup
Total Movement Avg
The average total non-gravity movement for all pitches of this type in the given event year. Measured in inches (in).
Fastball
Velocity Max
The maximum observed fastball velocity in the given event year. Measured in miles per hour (MPH).
87.5
Fastball
Velocity Avg
The average velocity for all pitches of this type in the given event year. Measured in miles per hour (MPH).
84.9
Fastball
Spin Rate Avg
The average rate of spin for all pitches of this type in the given event year. Measured in rotations per minute (RPM).
2142
Fastball
Spin Score Avg
The average Bauer Units value of all fastballs in the given event year. Bauer Units are calculated for each pitch by dividing Spin Rate by Velocity.
25.2
Fastball
Total Movement Avg
The average total non-gravity movement for all pitches of this type in the given event year. Measured in inches (in).
Curveball
Velocity Avg
The average velocity for all pitches of this type in the given event year. Measured in miles per hour (MPH).
68.3
Curveball
Spin Rate Avg
The average rate of spin for all pitches of this type in the given event year. Measured in rotations per minute (RPM).
2135
Curveball
Total Movement Avg
The average total non-gravity movement for all pitches of this type in the given event year. Measured in inches (in).
Changeup
Velocity Avg
The average velocity for all pitches of this type in the given event year. Measured in miles per hour (MPH).
75.4
Changeup
Spin Rate Avg
The average rate of spin for all pitches of this type in the given event year. Measured in rotations per minute (RPM).
1815
Area Code ID Series: New Jersey
Mar 7, 2021
Trackman - Fastball
88.2
Velocity (max)
86.6 - 88.0
Velo Range
2,019
Spin Rate (max)
1,973
Spin Rate (avg)
IVB (max)
IVB (avg)
HM (max)
HM (avg)
Extension (avg)
Release Ht (avg)
Spin Score (max)
Zone %
Trackman - Curveball
72.2
Velocity (max)
69.9 - 71.8
Velo Range
68.9
Eff Velocity (avg)
2,188
Spin Rate (max)
2,123
Spin Rate (avg)
IVB (max)
IVB (avg)
HM (max)
HM (avg)
Extension (avg)
Release Ht (avg)
Spin Score (max)
Zone %
Trackman - ChangeUp
81.5
Velocity (max)
77.6 - 81.5
Velo Range
2,008
Spin Rate (max)
1,869
Spin Rate (avg)
IVB (max)
IVB (avg)
HM (max)
HM (avg)
Extension (avg)
Release Ht (avg)
Spin Score (max)
Zone %
PBR Future Games (Team NJ Invite)
Aug 2, 2020
Trackman - Fastball
87.5
Velocity (max)
83.7 - 86.5
Velo Range
83.0
Eff Velocity (avg)
2,209
Spin Rate (max)
2,103
Spin Rate (avg)
IVB (max)
IVB (avg)
HM (max)
HM (avg)
Extension (avg)
Release Ht (avg)
Spin Score (max)
Zone %
Trackman - Curveball
70.4
Velocity (max)
67.5 - 69.3
Velo Range
2,233
Spin Rate (max)
2,152
Spin Rate (avg)
IVB (max)
IVB (avg)
HM (max)
HM (avg)
Extension (avg)
Release Ht (avg)
Spin Score (max)
Zone %
Trackman - ChangeUp
75.8
Velocity (max)
75.0 - 75.8
Velo Range
74.1
Eff Velocity (avg)
1,822
Spin Rate (max)
1,815
Spin Rate (avg)
Extension (avg)
Release Ht (avg)
Spin Score (max)
Zone %
2020 NJ Future Games Select (Session I)
Jul 5, 2020
Trackman - Fastball
86.5
Velocity (max)
82.6 - 86.3
Velo Range
83.5
Eff Velocity (avg)
2,340
Spin Rate (max)
2,260
Spin Rate (avg)
IVB (max)
IVB (avg)
HM (max)
HM (avg)
Extension (avg)
Release Ht (avg)
Spin Score (max)
Zone %
Trackman - Curveball
69.6
Velocity (max)
67.1 - 69.3
Velo Range
67.0
Eff Velocity (avg)
2,159
Spin Rate (max)
2,095
Spin Rate (avg)
IVB (max)
IVB (avg)
HM (max)
HM (avg)
Extension (avg)
Release Ht (avg)
Spin Score (max)
Pitch Scores
2020
Fastball
Hop+
A fastball with hop has a flat approach angle and visually jumps through the zone. When thrown up in the zone, it is more likely to generate a higher swing and miss average. Hop+ of 100 is MLB average.
Fastball
Sink+
A fastball with sink has low backspin and drops through the strike zone. When thrown down in the zone, it is more likely to generate a higher ground ball percentage and lower launch angle. Sink+ of 100 is MLB average.
Fastball
Rise+
A fastball with rise has a high percentage of backspin. When thrown up in the zone, it is more likely to generate a higher fly ball percentage. Rise+ of 100 is MLB average
Curveball
Hammer+
A hammer breaking ball drops vertically with velocity through the zone, or 12-to-6 movement. Hammer+ of 100 is MLB average.
Curveball
Sweep+
A sweeping breaking ball moves horizontally with velocity through the zone. Sweep+ of 100 is MLB average.
Pitching Velos
2021
2020
Fastball
Velocity Max
The maximum observed fastball velocity in the given event year. Measured in miles per hour (MPH).
88.0
Fastball
Velocity Avg
The average velocity for all pitches of this type in the given event year. Measured in miles per hour (MPH)
87.5
Curveball
Velocity Avg
The average velocity for all pitches of this type in the given event year. Measured in miles per hour (MPH)
71.0
Changeup
Velocity Avg
The average velocity for all pitches of this type in the given event year. Measured in miles per hour (MPH)
79.5
Fastball
Velocity Max
The maximum observed fastball velocity in the given event year. Measured in miles per hour (MPH).
88.0
Fastball
Velocity Avg
The average velocity for all pitches of this type in the given event year. Measured in miles per hour (MPH)
84.3
Curveball
Velocity Avg
The average velocity for all pitches of this type in the given event year. Measured in miles per hour (MPH)
68.2
Game Performance

Visual Edge

Pitch Ai

Notes
News
- NJ 2023 High School Scout Blog: Edition 6 - May 22, 2023
- Get to Know: Steven Echavarria - Jan 25, 2023
- Updated 2023 New Jersey Player Rankings - Sep 7, 2022
- 2022 Area Code Games: Standout Pitchers - Aug 18, 2022
- Updated NJ 2023 Rankings - May 12, 2022
- Updated and Expanded 2023 Rankings - May 12, 2020
- Wladyka Pitcher's Showcase: Top Performers - Mar 8, 2020
Comments
Draft Reports
Contact
Premium Content Area
To unlock contact information, you need to purchase a ScoutPLUS subscription.
Purchase Subscription OR
Login


 Sign in to view rankings
5-foot-11, 155-pound lanky frame. One of the top pitching prospects out of the entire event, and one of the top arms in his class. During the event, clocked a 60 time of 7.11. Began in a balanced stance with a smooth load, then used a controlled stride to initiate his swing. Bat speed was quick, showed level swing plane and high finish. Through his round he found some barrels. the right-handed hitter had an exit velocity of 85 mph. In the outfield, his best throw of the day was clocked at 83 mph. In the infield, showed a quick exchange and athletic footwork. Consistent accuracy to the bag, used a very quick arm action and a high ¾ slot. Advanced on the mound, where he showed quick arm speed, also used a loose arm action and a high ¾ arm angle. Uses easy effort in his delivery. Showed athletic balance point and uphill shoulders. Lands square with an athletic finish. Threw his fastball 84-86 mph with a max of 87 mph; has very consistent control and plus action. His 11/5 curveball (67-70) showed consistent control and swing and miss action.