CLASS OF 2023
SS
2B
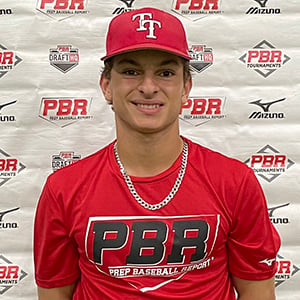
Sohrab
Rezaei
Wabash Valley JC
University of Chicago Laboratory Schools (HS) • IL
5' 8" • 165LBS
R/R • 19yr 7mo
Travel Team: Top Tier Americans
University of Chicago Laboratory Schools (HS) • IL
5' 8" • 165LBS
R/R • 19yr 7mo
Travel Team: Top Tier Americans
Rankings
2023 National
Rankings available to Premium Subscriber
2023 State
Rankings available to Premium Subscriber
Commitment
Best Of Stats
23.6
Hand Speed (max)
8/09/22
81.2
Bat Speed (max)
6/28/22
22.7
Rot. Acc (max)
8/09/22
40
Hard Hit %
6/28/22
95.9
Exit Velocity (max)
8/09/22
87.1
Exit Velocity (avg)
6/08/22
367
Distance (max)
6/28/22
73
Sweet Spot %
6/08/22
6.81
60
8/09/22
3.88
30-yd
6/28/22
1.72
10-yd
6/28/22
20.4
Run speed (max)
6/28/22
84
INF Velo
6/08/22
-
OF Velo
-
C Velo
-
Pop Time
Fastball
70
Velocity (max)
6/13/21
68 - 69
Velo Range
6/13/21
-
Spin Rate (avg)
Curveball
54 - 56
Velo Range
6/13/21
-
Spin Rate (avg)
Positional Tools
2022
2021
2019
60 Yard Dash
The athlete's fastest 60-yard dash time in the given event year. Measured in seconds (s)
6.81
Infield Velocity
The athlete's maximum throwing velocity from an infield position in the given event year. Measured in miles per hour (MPH).
84.0
Power / Speed Score
A simple calculation that divides the athlete’s Exit Velocity Max by the athlete’s 60 Yard Dash time for the given event year. For example, 98 MPH / 7.00s = 14.00.
14.1
60 Yard Dash
The athlete's fastest 60-yard dash time in the given event year. Measured in seconds (s)
7.15
Infield Velocity
The athlete's maximum throwing velocity from an infield position in the given event year. Measured in miles per hour (MPH).
78.0
Power / Speed Score
A simple calculation that divides the athlete’s Exit Velocity Max by the athlete’s 60 Yard Dash time for the given event year. For example, 98 MPH / 7.00s = 14.00.
12.5
60 Yard Dash
The athlete's fastest 60-yard dash time in the given event year. Measured in seconds (s)
7.76
Infield Velocity
The athlete's maximum throwing velocity from an infield position in the given event year. Measured in miles per hour (MPH).
64.0
Power / Speed Score
A simple calculation that divides the athlete’s Exit Velocity Max by the athlete’s 60 Yard Dash time for the given event year. For example, 98 MPH / 7.00s = 14.00.
9.5
Hitting

2022
2021
Exit Velocity Max
The highest exit velocity of any batted ball in the given event year. Measured in miles per hour (MPH).
95.9
Exit Velocity Avg
Average exit velocity of all batted balls in the given event year. Measured in miles per hour (MPH).
85.5
Distance Max
The highest flight distance of any batted ball in the given event year. Measured in feet (ft).
367
Distance Avg
Average flight distance of all batted balls in the given event year. Measured in feet (ft).
269
Launch Angle Avg
Average launch angle of all batted balls in the given event year. Measured in degrees.
27.7
Hard Hit %
Percentage of batted balls with exit velocities over 95 MPH in the given event year.
Sweet Spot %
Percentage of batted balls in the given event year with a launch angle between 8° and 32°.
Line Drive %
Percentage of batted balls with launch angles between 10 and 25 degrees in the given event year.
Fly Ball %
Percentage of batted balls with launch angles between 25 and 50 degrees in the given event year.
Ground Ball %
Percentage of batted balls with launch angles below 10 degrees in the given event year.
Exit Velocity Max
The highest exit velocity of any batted ball in the given event year. Measured in miles per hour (MPH).
89.3
Exit Velocity Avg
Average exit velocity of all batted balls in the given event year. Measured in miles per hour (MPH).
81.3
Distance Max
The highest flight distance of any batted ball in the given event year. Measured in feet (ft).
311
Distance Avg
Average flight distance of all batted balls in the given event year. Measured in feet (ft).
201
Launch Angle Avg
Average launch angle of all batted balls in the given event year. Measured in degrees.
20.5
Hard Hit %
Percentage of batted balls with exit velocities over 95 MPH in the given event year.
Sweet Spot %
Percentage of batted balls in the given event year with a launch angle between 8° and 32°.
Line Drive %
Percentage of batted balls with launch angles between 10 and 25 degrees in the given event year.
Fly Ball %
Percentage of batted balls with launch angles between 25 and 50 degrees in the given event year.
Ground Ball %
Percentage of batted balls with launch angles below 10 degrees in the given event year.
Illinois State Games (Invite-Only)
Aug 9, 2022
Trackman - Hitting
95.9
Exit Velocity (max)
83.2
Exit Velocity (avg)
223
Distance (avg)
310
Distance (max)
Hard Hit %
Sweet Spot %
Line Drive %
Fly Ball %
Ground Ball %
West Suburban Open
Jun 28, 2022
Trackman - Hitting
93.6
Exit Velocity (max)
86.9
Exit Velocity (avg)
289
Distance (avg)
367
Distance (max)
Hard Hit %
Sweet Spot %
Line Drive %
Fly Ball %
Top Tier Scout Day
Jun 8, 2022
Trackman - Hitting
95.2
Exit Velocity (max)
87.1
Exit Velocity (avg)
308
Distance (avg)
333
Distance (max)
Hard Hit %
Sweet Spot %
Line Drive %
Fly Ball %
Class of 2023 Showcase
Oct 10, 2021
Trackman - Hitting
89.3
Exit Velocity (max)
79.1
Exit Velocity (avg)
220
Distance (avg)
311
Distance (max)
Sweet Spot %
Line Drive %
Fly Ball %
Ground Ball %
Top Tier Scout Day
Jun 13, 2021
Trackman - Hitting
88.9
Exit Velocity (max)
83.7
Exit Velocity (avg)
181
Distance (avg)
277
Distance (max)
Sweet Spot %
Line Drive %
Fly Ball %
Ground Ball %
Hitting

2022
2021
Hand Speed Max
The highest Peak Hand Speed of any swing in the given event year.
23.6
Hand Speed Avg
The average Peak Hand Speed for all swings in the given event year.
21.3
Bat Speed Max
The highest Bat Speed of any swing in the given event year.
81.2
Bat Speed Avg
The average Bat Speed for all swings in the given event year.
74.7
Rotational Acceleration Max
The highest Rotational Acceleration of any swing in the given event year.
Rotational Acceleration Avg
The average Rotational Acceleration for all swings in the given event year.
On-Plane Efficiency Max
The highest On-Plane Efficiency of any swing in the given event year.
On-Plane Efficiency Avg
The average On-Plane Efficiency for all swings in the given event year.
Hand Speed Max
The highest Peak Hand Speed of any swing in the given event year.
20.9
Hand Speed Avg
The average Peak Hand Speed for all swings in the given event year.
20.1
Bat Speed Max
The highest Bat Speed of any swing in the given event year.
69.6
Bat Speed Avg
The average Bat Speed for all swings in the given event year.
66.1
Rotational Acceleration Max
The highest Rotational Acceleration of any swing in the given event year.
Rotational Acceleration Avg
The average Rotational Acceleration for all swings in the given event year.
On-Plane Efficiency Max
The highest On-Plane Efficiency of any swing in the given event year.
On-Plane Efficiency Avg
The average On-Plane Efficiency for all swings in the given event year.
Illinois State Games (Invite-Only)
Aug 9, 2022
Blast - Hitting
23.6
Hand Speed (max)
22.1
Hand Speed (avg)
79.3
Bat Speed (max)
74.0
Bat Speed (avg)
Rot. Acc (max)
Rot. Acc (avg)
On Plane Eff (avg)
MaxOnPlaneEfficiency
West Suburban Open
Jun 28, 2022
Blast - Hitting
23.0
Hand Speed (max)
20.2
Hand Speed (avg)
81.2
Bat Speed (max)
75.6
Bat Speed (avg)
Rot. Acc (max)
Rot. Acc (avg)
On Plane Eff (avg)
MaxOnPlaneEfficiency
Class of 2023 Showcase
Oct 10, 2021
Blast - Hitting
20.9
Hand Speed (max)
20.7
Hand Speed (avg)
69.6
Bat Speed (max)
68.6
Bat Speed (avg)
Rot. Acc (max)
Rot. Acc (avg)
On Plane Eff (avg)
MaxOnPlaneEfficiency
Top Tier Scout Day
Jun 13, 2021
Blast - Hitting
20.4
Hand Speed (max)
19.9
Hand Speed (avg)
67.0
Bat Speed (max)
65.2
Bat Speed (avg)
Rot. Acc (max)
Rot. Acc (avg)
On Plane Eff (avg)
MaxOnPlaneEfficiency
Pitching

Pitch Scores
Pitching Velos
2021
Fastball
Velocity Max
The maximum observed fastball velocity in the given event year. Measured in miles per hour (MPH).
70.0
Fastball
Velocity Avg
The average velocity for all pitches of this type in the given event year. Measured in miles per hour (MPH)
68.5
Curveball
Velocity Avg
The average velocity for all pitches of this type in the given event year. Measured in miles per hour (MPH)
55.0
Game Performance

2022
10 Yard Dash
The athlete's fastest 0-10-yard split time in the given event year. Measured in seconds.
1.72
30 Yard Dash
The athlete's fastest 0-30-yard split time in the given event year. Measured in seconds.
3.88
60 Yard Dash
The athlete's fastest 0-60-yard time in the given event year. Measured in seconds.
6.88
Top Speed (MPH)
The athlete's fastest split time converted to miles per hour.
RSi
The reactive strength index measurement of an athlete's explosiveness by comparing their jump height to the ground contact time in between their jumps. On a scale of 0-5.
Vertical Jump
A measure of any athlete's body strength and reach calculated from the flight time divided by the contact time.
Illinois State Games (Invite-Only)
Aug 9, 2022
Swift
1.67
10-yd
3.82
30-yd
6.81
60-yd
20.5
Run speed (max)
8.8
Run Speed (avg)
2.35
RSi (max)
2.35
RSi (avg)
1,471
Jump Power (max)
27.2
Jump Height (max)
26.8
Jump Height (avg)
West Suburban Open
Jun 28, 2022
Swift
1.72
10-yd
3.88
30-yd
6.88
60-yd
20.4
Run speed (max)
8.7
Run Speed (avg)
2.13
RSi (max)
1.64
RSi (avg)
1,420
Jump Power (max)
26.2
Jump Height (max)
26.1
Jump Height (avg)
Visual Edge

2022
Edge Score
The highest Edge Score within the given year. Edge Score is a comprehensive score that takes the core-six visual skills into account, providing an assessment of an athlete’s overall visual ability.
80.84
Pitch Ai

Notes
News
- Illinois State Games: 2023 Position Player Analysis - Oct 31, 2022
- Top Tier Scout Day: Takeaways - Aug 17, 2022
- Illinois State Games: Takeaways - Aug 15, 2022
- Illinois State Games: Roster Preview - Aug 4, 2022
- West Suburban Open: Quick Hits - Jul 6, 2022
- Midwest Premier Super 17 (Member): Preview Story - Jun 22, 2022
- Class of 2023 Showcase: Top Overall Prospects - Feb 24, 2022
- Class of 2023 Showcase: Infield Analysis - Feb 22, 2022
- Class Of 2023 Showcase: Quick Hits - Oct 14, 2021
- Future Prospects Showcase & Educational Camp - McCook: Player Analysis - May 28, 2019
Comments
Draft Reports
Contact
Premium Content Area
To unlock contact information, you need to purchase a ScoutPLUS subscription.
Purchase Subscription OR
Login


 Sign in to view rankings
INF Sohrab Rezaei (University of Chicago Laboratory Schools, 2023) continues to impress our scouts each time we see him. A 6.81 runner in the 60-yard dash, Rezaei’s athleticism was on display early, as he jumped all over a fastball and flew around the bases for a double in his first at-bat of the weekend. He generates easy bat speed from the right side and produces quality bat-to-ball data as a result, peaking at 95.9 mph off the barrel in BP on Tuesday. In game, he covers the whole plate, can hit the ball where it is pitched and is always ready to hit; spark plug presence to a lineup. Sure-handed on the infield with athletic feet to pair, Rezaei remains one of the top uncommitted infielders on the market in Illinois.
Positional Profile: SS/2B
Body: 5-8, 165-pounds. Compact, athletic frame.
Hits: RHH. Balanced setup, fluid pre-pitch load and leg-kick. Quick, athletic hands, swings with intent, bat stays level and long through the hitting zone. Finished game play 2-for-9, 2B.
Power: 96 max exit velocity, averaged 83.2 MPH. 310' max distance.
Arm: RH. INF-82 mph.Clean arm action, over-the-top slot, can drop down and alter when needed.
Defense: Quick feet, high-motor defender, athletic actions, confident hands and winds up through release.
Run: 6.81 runner in the 60.
Vizual Edge: 80.84 Edge Score
At the plate the 5-foot-8, 165-pound, right-handed hitter stays extremely compact and repeatable with above-average barrel feel. Rezaei sprayed hard, lifted contact to all parts of the diamond and was on the barrel at a high-rate. Rezaei averaged the top bat speed of the event at 75.6 mph. Defensively, he is an athletic, bouncy defender with soft confident hands and plays well on the move. His arm plays accurately from multiple slots and topped at 82 mph (has been 84 in the past. Rezaei also ran a 6.88 60 and registered a max exit velocity of 94 mph.
Positional Profile: SS
Body: 5-8, 165-pounds. Strong, compact build, round shoulders with a developed lower half.
Hit: RHH. Balanced setup, high leg-lift stride. Loose, short, quick, pull side approach, ball jumps at contact, flashed bat speed, power to centerfield.
Power: 93.6 max exit velocity, averaged 86.9 mph. 366’ max distance.
Arm: RH. INF - 82 mph. Loose, clean arm, plays from multiple slots and on the move.
Defense: Soft hands, quick feet, confident feel, loose actions, quick hands.
Run: 6.88 runner in the 60.
INF Sohrab Rezaei (University of Chicago Laboratory, 2023) is a high-academic middle infielder who has one of the top all-around games of anyone in attendance. The right-handed hitter has a compact swing that is highly-repeatable with advanced hand/eye coordination and the ability to cover the whole plate. Rezaei moved gracefully on defense throughout his round. He has a quick first step and explodes to the ball, receiving the ball with soft quick hands and cradling into a strong throwing position. He releases the ball from a high ¾ slot while placing his throws accurately on the bag.
Positional Profile: SS/2B
Body: 5-8, 155-pounds. Small, athletic body.
Hit: R. Athletic, balance stance, rested hands, minimal load, small leg lift. Compact, repeatable swing, drive the ball to the middle/pull side.
Power: 89.34 max exit velocity, averaged 79.1 mph. 311’ max distance.
Arm: R. INF - 78 mph. Short arm action, 3/4 slot.
Defense: Gets around the ball while playing to it, field low and out in front, soft hands.
Run: 7.15 runner in the 60.
Positional Profile: SS/C
Body: 5-5, 130-pounds.
Defense: Natural infield actions, fluid footwork.
Arm: RH. INF - 64 mph. Long arm action, high 3/4 slot.
Hit: RHH. Balanced set up, short stride. Loose, quick bat, short bat path.
Power: 74 mph exit velocity from the tee.
Run: 7.76 runner in the 60.