CLASS OF 2025
SS
2B
Karlos
Otero
Romeoville (HS) • IL
5' 10" • 163LBS
R/R • 17yr 7mo
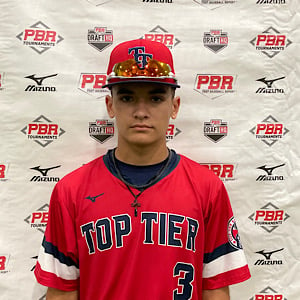
Travel Team: Top Tier Americans
5' 10" • 163LBS
R/R • 17yr 7mo
Travel Team: Top Tier Americans
Rankings
2025 National
Rankings available to Premium Subscriber
2025 State
Rankings available to Premium Subscriber
Commitment
Best Of Stats
21.9
Hand Speed (max)
2/24/24
77.6
Bat Speed (max)
2/24/24
11
Rot. Acc (max)
2/25/23
33
Hard Hit %
2/24/24
91.3
Exit Velocity (max)
2/24/24
84.1
Exit Velocity (avg)
2/24/24
311
Distance (max)
7/26/23
100
Sweet Spot %
7/28/21
6.67
60
2/24/24
3.81
30-yd
7/26/23
1.69
10-yd
7/26/23
20.6
Run speed (max)
7/26/23
88
INF Velo
2/25/23
-
OF Velo
-
C Velo
-
Pop Time
Positional Tools
2024
2023
2022
2021
2020
60 Yard Dash
The athlete's fastest 60-yard dash time in the given event year. Measured in seconds (s)
6.67
Infield Velocity
The athlete's maximum throwing velocity from an infield position in the given event year. Measured in miles per hour (MPH).
86.0
Power / Speed Score
A simple calculation that divides the athlete’s Exit Velocity Max by the athlete’s 60 Yard Dash time for the given event year. For example, 98 MPH / 7.00s = 14.00.
13.7
60 Yard Dash
The athlete's fastest 60-yard dash time in the given event year. Measured in seconds (s)
6.79
Infield Velocity
The athlete's maximum throwing velocity from an infield position in the given event year. Measured in miles per hour (MPH).
88.0
Power / Speed Score
A simple calculation that divides the athlete’s Exit Velocity Max by the athlete’s 60 Yard Dash time for the given event year. For example, 98 MPH / 7.00s = 14.00.
13.0
60 Yard Dash
The athlete's fastest 60-yard dash time in the given event year. Measured in seconds (s)
7.15
Infield Velocity
The athlete's maximum throwing velocity from an infield position in the given event year. Measured in miles per hour (MPH).
80.0
Power / Speed Score
A simple calculation that divides the athlete’s Exit Velocity Max by the athlete’s 60 Yard Dash time for the given event year. For example, 98 MPH / 7.00s = 14.00.
11.7
60 Yard Dash
The athlete's fastest 60-yard dash time in the given event year. Measured in seconds (s)
7.32
Infield Velocity
The athlete's maximum throwing velocity from an infield position in the given event year. Measured in miles per hour (MPH).
72.0
Power / Speed Score
A simple calculation that divides the athlete’s Exit Velocity Max by the athlete’s 60 Yard Dash time for the given event year. For example, 98 MPH / 7.00s = 14.00.
10.8
60 Yard Dash
The athlete's fastest 60-yard dash time in the given event year. Measured in seconds (s)
8.52
Infield Velocity
The athlete's maximum throwing velocity from an infield position in the given event year. Measured in miles per hour (MPH).
60.0
Power / Speed Score
A simple calculation that divides the athlete’s Exit Velocity Max by the athlete’s 60 Yard Dash time for the given event year. For example, 98 MPH / 7.00s = 14.00.
8.1
Hitting

2024
2023
2022
2021
Exit Velocity Max
The highest exit velocity of any batted ball in the given event year. Measured in miles per hour (MPH).
91.3
Exit Velocity Avg
Average exit velocity of all batted balls in the given event year. Measured in miles per hour (MPH).
84.1
Distance Max
The highest flight distance of any batted ball in the given event year. Measured in feet (ft).
295
Distance Avg
Average flight distance of all batted balls in the given event year. Measured in feet (ft).
145
Launch Angle Avg
Average launch angle of all batted balls in the given event year. Measured in degrees.
15.3
Hard Hit %
Percentage of batted balls with exit velocities over 95 MPH in the given event year.
Sweet Spot %
Percentage of batted balls in the given event year with a launch angle between 8° and 32°.
Line Drive %
Percentage of batted balls with launch angles between 10 and 25 degrees in the given event year.
Fly Ball %
Percentage of batted balls with launch angles between 25 and 50 degrees in the given event year.
Ground Ball %
Percentage of batted balls with launch angles below 10 degrees in the given event year.
Exit Velocity Max
The highest exit velocity of any batted ball in the given event year. Measured in miles per hour (MPH).
88.3
Exit Velocity Avg
Average exit velocity of all batted balls in the given event year. Measured in miles per hour (MPH).
82.2
Distance Max
The highest flight distance of any batted ball in the given event year. Measured in feet (ft).
311
Distance Avg
Average flight distance of all batted balls in the given event year. Measured in feet (ft).
225
Launch Angle Avg
Average launch angle of all batted balls in the given event year. Measured in degrees.
19.4
Hard Hit %
Percentage of batted balls with exit velocities over 95 MPH in the given event year.
Sweet Spot %
Percentage of batted balls in the given event year with a launch angle between 8° and 32°.
Line Drive %
Percentage of batted balls with launch angles between 10 and 25 degrees in the given event year.
Fly Ball %
Percentage of batted balls with launch angles between 25 and 50 degrees in the given event year.
Ground Ball %
Percentage of batted balls with launch angles below 10 degrees in the given event year.
Exit Velocity Max
The highest exit velocity of any batted ball in the given event year. Measured in miles per hour (MPH).
83.5
Exit Velocity Avg
Average exit velocity of all batted balls in the given event year. Measured in miles per hour (MPH).
76.3
Distance Max
The highest flight distance of any batted ball in the given event year. Measured in feet (ft).
276
Distance Avg
Average flight distance of all batted balls in the given event year. Measured in feet (ft).
199
Launch Angle Avg
Average launch angle of all batted balls in the given event year. Measured in degrees.
21.1
Hard Hit %
Percentage of batted balls with exit velocities over 95 MPH in the given event year.
Sweet Spot %
Percentage of batted balls in the given event year with a launch angle between 8° and 32°.
Line Drive %
Percentage of batted balls with launch angles between 10 and 25 degrees in the given event year.
Fly Ball %
Percentage of batted balls with launch angles between 25 and 50 degrees in the given event year.
Ground Ball %
Percentage of batted balls with launch angles below 10 degrees in the given event year.
Exit Velocity Max
The highest exit velocity of any batted ball in the given event year. Measured in miles per hour (MPH).
79.1
Exit Velocity Avg
Average exit velocity of all batted balls in the given event year. Measured in miles per hour (MPH).
69.2
Distance Max
The highest flight distance of any batted ball in the given event year. Measured in feet (ft).
249
Distance Avg
Average flight distance of all batted balls in the given event year. Measured in feet (ft).
166
Launch Angle Avg
Average launch angle of all batted balls in the given event year. Measured in degrees.
18.5
Hard Hit %
Percentage of batted balls with exit velocities over 95 MPH in the given event year.
Sweet Spot %
Percentage of batted balls in the given event year with a launch angle between 8° and 32°.
Line Drive %
Percentage of batted balls with launch angles between 10 and 25 degrees in the given event year.
Fly Ball %
Percentage of batted balls with launch angles between 25 and 50 degrees in the given event year.
Ground Ball %
Percentage of batted balls with launch angles below 10 degrees in the given event year.
Preseason All-State: Upperclass (Invite-Only)
Feb 24, 2024
Trackman - Hitting
91.3
Exit Velocity (max)
84.1
Exit Velocity (avg)
145
Distance (avg)
295
Distance (max)
Hard Hit %
Sweet Spot %
Line Drive %
Fly Ball %
Ground Ball %
FG Workout IL/IN/MDW/WI
Jul 26, 2023
Trackman - Hitting
85.5
Exit Velocity (max)
81.6
Exit Velocity (avg)
228
Distance (avg)
311
Distance (max)
Sweet Spot %
Line Drive %
Fly Ball %
Ground Ball %
2023 PBR Future Games
Jul 26, 2023
Trackman - Hitting
85.5
Exit Velocity (max)
81.6
Exit Velocity (avg)
228
Distance (avg)
311
Distance (max)
Sweet Spot %
Line Drive %
Fly Ball %
Ground Ball %
Preseason All-State: Underclass (Invite-Only)
Feb 25, 2023
Trackman - Hitting
88.3
Exit Velocity (max)
83.0
Exit Velocity (avg)
220
Distance (avg)
290
Distance (max)
Sweet Spot %
Line Drive %
Fly Ball %
Ground Ball %
Top Tier Scout Day
Jun 8, 2022
Trackman - Hitting
82.2
Exit Velocity (max)
75.9
Exit Velocity (avg)
187
Distance (avg)
245
Distance (max)
Sweet Spot %
Line Drive %
Fly Ball %
Ground Ball %
Preseason All-State: Underclass (Invite-Only)
Feb 26, 2022
Trackman - Hitting
83.5
Exit Velocity (max)
76.6
Exit Velocity (avg)
209
Distance (avg)
276
Distance (max)
Sweet Spot %
Line Drive %
Fly Ball %
Ground Ball %
Junior Future Games Workout - IL/WI
Jul 28, 2021
Trackman - Hitting
79.1
Exit Velocity (max)
69.2
Exit Velocity (avg)
166
Distance (avg)
249
Distance (max)
Sweet Spot %
Line Drive %
Fly Ball %
Hitting

2024
2023
2022
Hand Speed Max
The highest Peak Hand Speed of any swing in the given event year.
21.9
Hand Speed Avg
The average Peak Hand Speed for all swings in the given event year.
21.1
Bat Speed Max
The highest Bat Speed of any swing in the given event year.
77.6
Bat Speed Avg
The average Bat Speed for all swings in the given event year.
74.2
Rotational Acceleration Max
The highest Rotational Acceleration of any swing in the given event year.
Rotational Acceleration Avg
The average Rotational Acceleration for all swings in the given event year.
On-Plane Efficiency Max
The highest On-Plane Efficiency of any swing in the given event year.
On-Plane Efficiency Avg
The average On-Plane Efficiency for all swings in the given event year.
Hand Speed Max
The highest Peak Hand Speed of any swing in the given event year.
19.5
Hand Speed Avg
The average Peak Hand Speed for all swings in the given event year.
18.1
Bat Speed Max
The highest Bat Speed of any swing in the given event year.
69.8
Bat Speed Avg
The average Bat Speed for all swings in the given event year.
65.3
Rotational Acceleration Max
The highest Rotational Acceleration of any swing in the given event year.
Rotational Acceleration Avg
The average Rotational Acceleration for all swings in the given event year.
On-Plane Efficiency Max
The highest On-Plane Efficiency of any swing in the given event year.
On-Plane Efficiency Avg
The average On-Plane Efficiency for all swings in the given event year.
Hand Speed Max
The highest Peak Hand Speed of any swing in the given event year.
19.1
Hand Speed Avg
The average Peak Hand Speed for all swings in the given event year.
17.6
Bat Speed Max
The highest Bat Speed of any swing in the given event year.
69.0
Bat Speed Avg
The average Bat Speed for all swings in the given event year.
63.7
Rotational Acceleration Max
The highest Rotational Acceleration of any swing in the given event year.
Rotational Acceleration Avg
The average Rotational Acceleration for all swings in the given event year.
On-Plane Efficiency Max
The highest On-Plane Efficiency of any swing in the given event year.
On-Plane Efficiency Avg
The average On-Plane Efficiency for all swings in the given event year.
Preseason All-State: Upperclass (Invite-Only)
Feb 24, 2024
Blast - Hitting
21.9
Hand Speed (max)
21.1
Hand Speed (avg)
77.6
Bat Speed (max)
74.2
Bat Speed (avg)
Rot. Acc (max)
Rot. Acc (avg)
On Plane Eff (avg)
MaxOnPlaneEfficiency
2023 PBR Future Games
Jul 26, 2023
Blast - Hitting
19.3
Hand Speed (max)
18.5
Hand Speed (avg)
66.9
Bat Speed (max)
64.7
Bat Speed (avg)
Rot. Acc (max)
Rot. Acc (avg)
On Plane Eff (avg)
MaxOnPlaneEfficiency
Preseason All-State: Underclass (Invite-Only)
Feb 25, 2023
Blast - Hitting
19.5
Hand Speed (max)
17.2
Hand Speed (avg)
69.8
Bat Speed (max)
66.7
Bat Speed (avg)
Rot. Acc (max)
Rot. Acc (avg)
On Plane Eff (avg)
MaxOnPlaneEfficiency
Top Tier Scout Day
Jun 8, 2022
Blast - Hitting
19.1
Hand Speed (max)
18.0
Hand Speed (avg)
69.0
Bat Speed (max)
65.6
Bat Speed (avg)
Rot. Acc (max)
Rot. Acc (avg)
On Plane Eff (avg)
MaxOnPlaneEfficiency
Preseason All-State: Underclass (Invite-Only)
Feb 26, 2022
Blast - Hitting
17.5
Hand Speed (max)
16.9
Hand Speed (avg)
62.8
Bat Speed (max)
61.0
Bat Speed (avg)
Rot. Acc (max)
Rot. Acc (avg)
On Plane Eff (avg)
MaxOnPlaneEfficiency
Pitching

Pitch Scores
Pitching Velos
Game Performance

2024
2023
RSi
The reactive strength index measurement of an athlete's explosiveness by comparing their jump height to the ground contact time in between their jumps. On a scale of 0-5.
Vertical Jump
A measure of any athlete's body strength and reach calculated from the flight time divided by the contact time.
10 Yard Dash
The athlete's fastest 0-10-yard split time in the given event year. Measured in seconds.
1.69
30 Yard Dash
The athlete's fastest 0-30-yard split time in the given event year. Measured in seconds.
3.81
60 Yard Dash
The athlete's fastest 0-60-yard time in the given event year. Measured in seconds.
6.79
Top Speed (MPH)
The athlete's fastest split time converted to miles per hour.
Vertical Jump
A measure of any athlete's body strength and reach calculated from the flight time divided by the contact time.
Preseason All-State: Underclass (Invite-Only)
Feb 25, 2023
Swift
1.72
10-yd
3.84
30-yd
6.85
60-yd
20.4
Run speed (max)
1,460
Jump Power (max)
30.0
Jump Height (max)
29.7
Jump Height (avg)
Visual Edge

2023
2022
Edge Score
The highest Edge Score within the given year. Edge Score is a comprehensive score that takes the core-six visual skills into account, providing an assessment of an athlete’s overall visual ability.
61.79
Edge Score
The highest Edge Score within the given year. Edge Score is a comprehensive score that takes the core-six visual skills into account, providing an assessment of an athlete’s overall visual ability.
42.95
Pitch Ai

Notes
News
- 2024 Preseason All-State, Upperclass: Takeaways - Feb 29, 2024
- 2024 Preseason All-State, Upperclass: Preview - Feb 22, 2024
- Illinois Class of 2025 Rankings: Risers - Aug 31, 2023
- Team Illinois: Takeaways - Aug 1, 2023
- Team Illinois: Workout Day, Quick Hits - Jul 27, 2023
- 2023 Future Games Preview: Team Illinois - Jul 24, 2023
- Preseason All-State Underclass: Infield Analysis - May 18, 2023
- Week 6 Diamond Notes - Apr 28, 2023
- Preseason All State, Underclass: Quick Hits - Mar 1, 2023
- Inside The 2025 Illinois Rankings: On The Radar - Dec 9, 2022
- Preseason All-State Underclass: Infield Analysis - Jul 7, 2022
- Week 4 Games - Apr 13, 2022
- McCook Future Prospects Showcase: Player Analysis - Sep 20, 2021
- PBR at The Rock 13U & 14U: Scout Blog - Jun 2, 2020
- Future Prospects Showcase - The MAX: Analysis - May 29, 2020
Comments
Draft Reports
Contact
Premium Content Area
To unlock contact information, you need to purchase a ScoutPLUS subscription.
Purchase Subscription OR
Login
Physical
2023
Grip Strgth (LH)
Grip strength is a measure of a players bat control and ability to transfer power and speed during impact, measured in pounds of force generated; collected with elbow bent at 90 degrees.
Grip Strgth (RH)
Grip strength is a measure of a players bat control and ability to transfer power and speed during impact, measured in pounds of force generated; collected with elbow bent at 90 degrees.









 Sign in to view rankings
MIF Karlos Otero (Romeoville, 2025) swiftly moved around the infield turf, showcasing advanced up-the-middle actions defensively throughout the Future Games. Otero defends with plenty of rhythm and confidence, and he should have no issue sticking on the infield in the long run. He has the athleticism to do so as well, running a 6.79 60 while reaching 20.6 mph at peak speed. Offensively, Otero swings a short, simple, and easy right-handed barrel that works on top of the baseball, high bat-to-ball oriented swing, and he put together competitive at-bats consistently as the week rolled on.
PBR Future Games: MIF Karlos Otero (Romeoville, 2025) put together one of the smoother workouts of the day for Team Illinois. Measuring at 5-foot-9, 163 pounds, Otero’s athleticism and body control were on full display, running a 6.79 60-yard dash with a 1.69 10-yard split. The right-handed hitter has an extremely simple, quiet and repeatable approach, consistently staying on balance and on the barrel throughout his round. Defensively, Otero continued to shine where he is a fluid, fundamentally sound middle infielder with confident hands and the ability to play on the move with ease and body control. He also showed off plenty of arm strength to stay on the left side of the diamond long term, topping at 87 mph.
MIF Karlos Otero (Romeoville, 2025) put together one of the smoother workouts of the day for Team Illinois. Measuring at 5-foot-9, 163 pounds, Otero’s athleticism and body control were on full display, running a 6.79 60-yard dash with a 1.69 10-yard split. The right-handed hitter has an extremely simple, quiet and repeatable approach, consistently staying on balance and on the barrel throughout his round. Defensively, Otero continued to shine where he is a fluid, fundamentally sound middle infielder with confident hands and the ability to play on the move with ease and body control. He also showed off plenty of arm strength to stay on the left side of the diamond long term, topping at 87 mph.
PBR Future Games: INF Brady Green (Oak Park-River Forest) is another high-motor player with physicality to know on Team Illinois. Green, who’s built at a strong, compact 5-foot-11, 170-pounds, squared up one of the hardest balls in BP (97.1 mph) of all Team Illinois’ players during Wednesday’s workout. His best showing offensively was against Pennsylvania in game one, where he doubled down the left field line and scored a run, while also posting a 4.37 down the line on a groundout. We’ve long known Green as a quality defender too and this week was no different, as he moved around the infield fluidly with steady glovework to pair.
Romeoville went 2-2 on the week with two wins over Plainfield South (7-6 & 6-4). Otero was a big factor in their wins last week going 8-for-14 (.615) with a double, six RBIs, five runs scored, no strikeouts, six stolen bases, and no errors in the infield. In their 9-8 loss to Plainfield South, Otero went 3-for-4 with a double, two runs scored, and a stolen base. He added a hit with two RBIs, a walk and a stolen base in their 7-6 win over Plainfield South. He went a perfect 3-for-3 with two RBIs, two runs scored, and two stolen bases in their 6-4 win over Plainfield South.
Season Stats:
21-for-61 (.344 BA/.420 OBP), 4 2B, 16 RBI, 15 R, 11 SB, 10 K
INF Karlos Otero (Romeoville, 2025) was one of the biggest winners when it comes to current unranked prospects who attended the event. The 5-foot-9, 150-pound, well-proportioned, right-handed hitting infielder has a calm, quiet demeanor in the box, lets the ball get deep, stays short and direct to the ball with a repeatable swing and the ability to backspin line-drives back up the middle of the field. Otero's defense was on the rise as well, roaming the infield with athleticism and confidence - making plays to both sides of his glove look easy with range and soft hands. He also has added on some arm-strength, eight mph since the summer to be exact - reaching up to 88 mph across the diamond.
INF Karlos Otero (Romeoville, 2025) was one of the biggest winners when it comes to current unranked prospects who attended the event. The 5-foot-9, 150-pound, well-proportioned, right-handed hitting infielder has a calm, quiet demeanor in the box, lets the ball get deep, stays short and direct to the ball with a repeatable swing and the ability to backspin line-drives back up the middle of the field. Otero's defense was on the rise as well, roaming the infield with athleticism and confidence - making plays to both sides of his glove look easy with range and soft hands. He also has added on some arm-strength, eight mph since the summer to be exact - reaching up to 88 mph across the diamond.
Positional Profile: SS/2B
Body: 5-9, 150-pounds. Athletic build.
Hit: RHH. Balanced stance with a hand pump trigger and small leg kick. Quiet, repeatable swing, stays on balance throughout. Short, direct path, on top and on the barrel, backspin contact.
Power: 88 max exit velocity, averaged 83 mph. 290’ max distance.
Arm: RH. INF - 88 mph. Easy arm action with accuracy.
Defense: Athletic footwork through the ball, soft hands, easy range laterally, confident and fluid actions.
Run: 6.85 runner in the 60.
Uncommitted. Athletic 5-foot-9, 150-pound frame. Started at shortstop and hit out of the nine-hole as just a freshman. Otero took impressive reps on the infield during IO, showcasing athletic/smooth actions with soft hands, also has a polished feel. At the plate, Otero starts in a crouched, slightly open stance, utilizing a short/simple stride moving through the zone with a level bat-path. Otero held his own in the box against some talented arms, and should only continue to improve as he gets more reps on varsity.
Positional Profile: SS/2B
Body: 5-6, 128-pounds. Short, compact frame.
Hit: RHH. Balanced setup, front shoulder lean, short stride, minimal load. Stays on top of the baseball, controls the barrel, line-drive approach.
Power: 83.5 max exit velocity, averaged 76.6 mph. 275’ max distance.
Arm: RH. INF - 80 mph. Short, clean arm path. Works from a 3/4 slot. Accurate throws on the move.
Defense: Clean footwork, efficient actions.
Run: 7.46 runner in the 60.
5-foot-6, 130-pound shortstop. Right-handed hitter, hits leadoff, prototypical lead off approach, went deep into counts and worked his way on base, line drive swing short to the baseball, spray singles type hitter. Defensively plays with confident actions, hands are soft with advance body control and footwork.
Position: SS/2B
Body: 5-foot-1, 94-pound athletic projectable build.
Hit: (RHH) Begins in an athletic balanced stance with a smooth load, then uses a short stride. Flashed bat speed. Balanced finish, short long swing. Line drive gap to gap approach.
Power: 73 mph exit velocity.
Defense: (IF) Next level hands, athletic footwork, natural exchange. Advanced.
Arm: 68 mph infield velocity. Short arm action, side slot.
Speed: 7.57 (60-yard dash).
5-foot-1, 94-pound middle infielder; diminutive stature with athletic all-around actions. Lead-off hitter for Top Tier Americans; balanced/athletic setup, easy to contact, short to contact, athletic finish. Stands out in particular on defense, especially at second base; glides to ground balls in rhythm, smooth actions through funnel and release.
Positional Profile: SS/2B
Body: 5-1, 94-pounds. Lean.
Defense: Advanced actions, athletic feet that field in rhythm, soft hands, clean and quick to release, plays through the baseball. Smooth all-around defender.
Arm: RH. INF - 60 mph. Short arm action, high 3/4 slot.
Hit: RH. Balanced setup, simple load, short stride, stays balanced through contact. Simple swing, loose hands, short and uphill path, line drive approach, fluid rhythm throughout, feel to hit.
Power: 69 mph exit velocity from the tee.
Run: 8.52 runner in the 60.