CLASS OF 2022
OF
LHP
Kannon
Walker
Lake Land JC
Belleville East (HS) • IL
5' 10" • 160LBS
L/R • 21yr 6mo
Travel Team: GBA
Belleville East (HS) • IL
5' 10" • 160LBS
L/R • 21yr 6mo
Travel Team: GBA
Rankings
2022 National
Rankings available to Premium Subscriber
2022 State
Rankings available to Premium Subscriber
Commitment
Best Of Stats
22.6
Hand Speed (max)
9/08/23
74.2
Bat Speed (max)
9/08/23
13.2
Rot. Acc (max)
9/08/23
50
Hard Hit %
9/08/23
94.9
Exit Velocity (max)
9/08/23
85.7
Exit Velocity (avg)
9/08/23
365
Distance (max)
9/08/23
70
Sweet Spot %
9/08/23
6.99
60
5/30/21
-
30-yd
1.71
10-yd
9/08/23
18.9
Run speed (max)
9/08/23
-
INF Velo
86
OF Velo
9/08/23
-
C Velo
-
Pop Time
Fastball
83
Velocity (max)
9/08/23
81 - 82.5
Velo Range
9/08/23
2457
Spin Rate (avg)
9/08/23
Changeup
76.9 - 78.1
Velo Range
9/08/23
1551
Spin Rate (avg)
9/08/23
Curveball
74 - 76
Velo Range
9/08/23
2597
Spin Rate (avg)
9/08/23
Positional Tools
2023
2021
2020
60 Yard Dash
The athlete's fastest 60-yard dash time in the given event year. Measured in seconds (s)
7.12
Outfield Velocity
The athlete's maximum throwing velocity from an outfield position in the given event year. Measured in miles per hour (MPH).
86.0
Power / Speed Score
A simple calculation that divides the athlete’s Exit Velocity Max by the athlete’s 60 Yard Dash time for the given event year. For example, 98 MPH / 7.00s = 14.00.
13.3
60 Yard Dash
The athlete's fastest 60-yard dash time in the given event year. Measured in seconds (s)
6.99
Outfield Velocity
The athlete's maximum throwing velocity from an outfield position in the given event year. Measured in miles per hour (MPH).
82.0
Power / Speed Score
A simple calculation that divides the athlete’s Exit Velocity Max by the athlete’s 60 Yard Dash time for the given event year. For example, 98 MPH / 7.00s = 14.00.
12.6
60 Yard Dash
The athlete's fastest 60-yard dash time in the given event year. Measured in seconds (s)
7.11
Outfield Velocity
The athlete's maximum throwing velocity from an outfield position in the given event year. Measured in miles per hour (MPH).
80.0
Power / Speed Score
A simple calculation that divides the athlete’s Exit Velocity Max by the athlete’s 60 Yard Dash time for the given event year. For example, 98 MPH / 7.00s = 14.00.
12.7
Hitting

2023
2020
Exit Velocity Max
The highest exit velocity of any batted ball in the given event year. Measured in miles per hour (MPH).
94.9
Exit Velocity Avg
Average exit velocity of all batted balls in the given event year. Measured in miles per hour (MPH).
85.7
Distance Max
The highest flight distance of any batted ball in the given event year. Measured in feet (ft).
365
Distance Avg
Average flight distance of all batted balls in the given event year. Measured in feet (ft).
255
Launch Angle Avg
Average launch angle of all batted balls in the given event year. Measured in degrees.
30.9
Hard Hit %
Percentage of batted balls with exit velocities over 95 MPH in the given event year.
Sweet Spot %
Percentage of batted balls in the given event year with a launch angle between 8° and 32°.
Line Drive %
Percentage of batted balls with launch angles between 10 and 25 degrees in the given event year.
Fly Ball %
Percentage of batted balls with launch angles between 25 and 50 degrees in the given event year.
Ground Ball %
Percentage of batted balls with launch angles below 10 degrees in the given event year.
Exit Velocity Max
The highest exit velocity of any batted ball in the given event year. Measured in miles per hour (MPH).
90.1
Exit Velocity Avg
Average exit velocity of all batted balls in the given event year. Measured in miles per hour (MPH).
84.1
Distance Max
The highest flight distance of any batted ball in the given event year. Measured in feet (ft).
339
Distance Avg
Average flight distance of all batted balls in the given event year. Measured in feet (ft).
213
Launch Angle Avg
Average launch angle of all batted balls in the given event year. Measured in degrees.
20.6
Hard Hit %
Percentage of batted balls with exit velocities over 95 MPH in the given event year.
Sweet Spot %
Percentage of batted balls in the given event year with a launch angle between 8° and 32°.
Line Drive %
Percentage of batted balls with launch angles between 10 and 25 degrees in the given event year.
Fly Ball %
Percentage of batted balls with launch angles between 25 and 50 degrees in the given event year.
Ground Ball %
Percentage of batted balls with launch angles below 10 degrees in the given event year.
PBR IL: Lake Land JC / Olney JC Scout Day
Sep 8, 2023
Trackman - Hitting
94.9
Exit Velocity (max)
85.7
Exit Velocity (avg)
255
Distance (avg)
365
Distance (max)
Hard Hit %
Sweet Spot %
Line Drive %
Fly Ball %
All-State Games (Invite Only)
Jun 30, 2020
Trackman - Hitting
90.1
Exit Velocity (max)
84.1
Exit Velocity (avg)
213
Distance (avg)
339
Distance (max)
Hard Hit %
Sweet Spot %
Line Drive %
Fly Ball %
Ground Ball %
Hitting

2023
Hand Speed Max
The highest Peak Hand Speed of any swing in the given event year.
22.6
Hand Speed Avg
The average Peak Hand Speed for all swings in the given event year.
22.0
Bat Speed Max
The highest Bat Speed of any swing in the given event year.
74.2
Bat Speed Avg
The average Bat Speed for all swings in the given event year.
70.5
Rotational Acceleration Max
The highest Rotational Acceleration of any swing in the given event year.
Rotational Acceleration Avg
The average Rotational Acceleration for all swings in the given event year.
On-Plane Efficiency Max
The highest On-Plane Efficiency of any swing in the given event year.
On-Plane Efficiency Avg
The average On-Plane Efficiency for all swings in the given event year.
PBR IL: Lake Land JC / Olney JC Scout Day
Sep 8, 2023
Blast - Hitting
22.6
Hand Speed (max)
22.0
Hand Speed (avg)
74.2
Bat Speed (max)
70.5
Bat Speed (avg)
Rot. Acc (max)
Rot. Acc (avg)
On Plane Eff (avg)
MaxOnPlaneEfficiency
Pitching

2023
Fastball
Velocity Max
The maximum observed fastball velocity in the given event year. Measured in miles per hour (MPH).
82.5
Fastball
Velocity Avg
The average velocity for all pitches of this type in the given event year. Measured in miles per hour (MPH).
81.7
Fastball
Spin Rate Avg
The average rate of spin for all pitches of this type in the given event year. Measured in rotations per minute (RPM).
2457
Fastball
Spin Score Avg
The average Bauer Units value of all fastballs in the given event year. Bauer Units are calculated for each pitch by dividing Spin Rate by Velocity.
30.1
Fastball
Total Movement Avg
The average total non-gravity movement for all pitches of this type in the given event year. Measured in inches (in).
Curveball
Velocity Avg
The average velocity for all pitches of this type in the given event year. Measured in miles per hour (MPH).
74.9
Curveball
Spin Rate Avg
The average rate of spin for all pitches of this type in the given event year. Measured in rotations per minute (RPM).
2597
Curveball
Total Movement Avg
The average total non-gravity movement for all pitches of this type in the given event year. Measured in inches (in).
Changeup
Velocity Avg
The average velocity for all pitches of this type in the given event year. Measured in miles per hour (MPH).
77.6
Changeup
Spin Rate Avg
The average rate of spin for all pitches of this type in the given event year. Measured in rotations per minute (RPM).
1551
Changeup
Total Movement Avg
The average total non-gravity movement for all pitches of this type in the given event year. Measured in inches (in).
PBR IL: Lake Land JC / Olney JC Scout Day
Sep 8, 2023
Trackman - Fastball
82.5
Velocity (max)
81.0 - 82.5
Velo Range
79.0
Eff Velocity (avg)
2,527
Spin Rate (max)
2,457
Spin Rate (avg)
IVB (max)
IVB (avg)
HM (max)
HM (avg)
Extension (avg)
Release Ht (avg)
Spin Score (max)
Zone %
Spin Efficiency % (avg)
Trackman - Curveball
76.2
Velocity (max)
74.1 - 75.8
Velo Range
72.3
Eff Velocity (avg)
2,628
Spin Rate (max)
2,597
Spin Rate (avg)
IVB (max)
IVB (avg)
HM (max)
HM (avg)
Extension (avg)
Release Ht (avg)
Spin Score (max)
Trackman - ChangeUp
78.1
Velocity (max)
76.9 - 78.1
Velo Range
75.2
Eff Velocity (avg)
1,592
Spin Rate (max)
1,551
Spin Rate (avg)
IVB (max)
IVB (avg)
HM (max)
HM (avg)
Extension (avg)
Release Ht (avg)
Spin Score (max)
Spin Efficiency % (avg)
Pitch Scores
Pitching Velos
2023
2021
2020
Fastball
Velocity Max
The maximum observed fastball velocity in the given event year. Measured in miles per hour (MPH).
83.0
Fastball
Velocity Avg
The average velocity for all pitches of this type in the given event year. Measured in miles per hour (MPH)
81.5
Curveball
Velocity Avg
The average velocity for all pitches of this type in the given event year. Measured in miles per hour (MPH)
75.0
Changeup
Velocity Avg
The average velocity for all pitches of this type in the given event year. Measured in miles per hour (MPH)
77.5
Fastball
Velocity Max
The maximum observed fastball velocity in the given event year. Measured in miles per hour (MPH).
80.0
Fastball
Velocity Avg
The average velocity for all pitches of this type in the given event year. Measured in miles per hour (MPH)
79.0
Curveball
Velocity Avg
The average velocity for all pitches of this type in the given event year. Measured in miles per hour (MPH)
69.0
Changeup
Velocity Avg
The average velocity for all pitches of this type in the given event year. Measured in miles per hour (MPH)
70.0
Fastball
Velocity Max
The maximum observed fastball velocity in the given event year. Measured in miles per hour (MPH).
78.0
Fastball
Velocity Avg
The average velocity for all pitches of this type in the given event year. Measured in miles per hour (MPH)
77.0
Curveball
Velocity Avg
The average velocity for all pitches of this type in the given event year. Measured in miles per hour (MPH)
69.5
Changeup
Velocity Avg
The average velocity for all pitches of this type in the given event year. Measured in miles per hour (MPH)
70.5
Game Performance

2023
10 Yard Dash
The athlete's fastest 0-10-yard split time in the given event year. Measured in seconds.
1.71
60 Yard Dash
The athlete's fastest 0-60-yard time in the given event year. Measured in seconds.
7.12
Top Speed (MPH)
The athlete's fastest split time converted to miles per hour.
Visual Edge

Pitch Ai

Notes
News
- Illinois JUCO Scout Days: Uncommitted Position Players - Oct 30, 2023
- Updated Illinois Power 25 Rankings - May 23, 2022
- Week 8 Games - May 19, 2022
- Updated Illinois Power 25 Rankings - May 9, 2022
- Updated Illinois Power 25 Rankings - Apr 25, 2022
- Metro East Kickoff Classic: Scout Blog - Mar 25, 2022
- Preseason Power 25 Countdown: No. 25 Belleville East - Mar 4, 2022
- Best of 2021: 60-Yard Dash Leaders - Jan 5, 2022
- IL/WI All-State Games: Outfielder Analysis - Sep 15, 2020
Comments
Draft Reports
Contact
Premium Content Area
To unlock contact information, you need to purchase a ScoutPLUS subscription.
Purchase Subscription OR
Login


 Sign in to view rankings
Kannon Walker, OF/LHP, Belleville East (IL), 2022
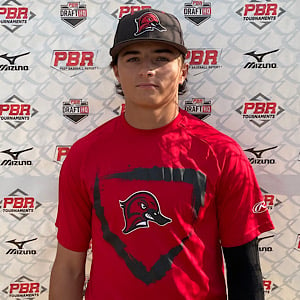
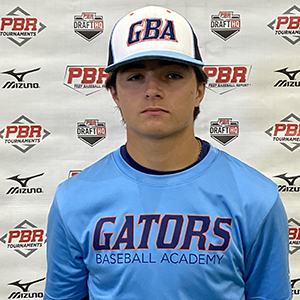
True sophomore. 5-foot-10, 160-pound frame, athletic with room to fill out physically. Impressive two-way showing for Walker, starting with his round of BP. The right-handed hitter has a fluid rhythm in the box, utilizing a small step to start his load with a slight separation in the hands, firing through with an uphill path and reaching up to 95 mph for his max EV with a max distance of 365’. Athletic defender in the outfield with soft hands and fluid actions, reaching up to 86 mph from a crow hop. Above-average runner, cruising to a 6.99 in the 60-yard dash. On the mound, the southpaw worked his fastball in the 81-82 mph range with above-average spin (2500+ RPM), pairing off a sharp 1/7 curveball at 74-76 mph (2600+ RPM) and fading changeup at 76-78 mph.
True sophomore. 5-foot-10, 160-pound frame, athletic with room to fill out physically. Impressive two-way showing for Walker, starting with his round of BP. The right-handed hitter has a fluid rhythm in the box, utilizing a small step to start his load with a slight separation in the hands, firing through with an uphill path and reaching up to 95 mph for his max EV with a max distance of 365’. Athletic defender in the outfield with soft hands and fluid actions, reaching up to 86 mph from a crow hop. Above-average runner, cruising to a 6.99 in the 60-yard dash. On the mound, the southpaw worked his fastball in the 81-82 mph range with above-average spin (2500+ RPM), pairing off a sharp 1/7 curveball at 74-76 mph (2600+ RPM) and fading changeup at 76-78 mph.
Lake Land JC commit, currently ranked No. 199 in the Illinois 2022 class. Compact frame, standing 5-foot-10, 157-pounds, evenly distributed weight. Came in relief of Mueth and fired 3.1 shutout innings while striking out four to just one walk and two hits. The southpaw’s arm works long out of the glove, wrist slightly curled inwards, before transitioning into a high ¾ slot. Down the mound, Walker moves with a controlled tempo, utilizing a slow and deliberate leg-lift into balance point, driving down the mound with a drop/drive lower-half that remains in-line to the plate. Walker’s fastball sat in the 80-82 mph range, playing with slight action to the arm-side. His go-to secondary offering was a sharp 2/8 slider, thrown with mature feel around the zone and slurvy shape at times, 72-76 mph.
Lake Land JC commit. 5-foot-10, 157-pound, right-handed hitting, left-handed throwing centerfielder. Hit lead off and took quality at-bats all day long with nothing to show for it. Athletic, quick swing, present bat-to-ball skills with a gap-to-gap approach. Quick first step in the outfield, easy glider, covers ground and has a strong, accurate arm.
Positional Profile: OF
Body: 5-10, 150-pounds. Athletic frame with compact strength.
Hit: RHH. Slightly closed setup, hands tuck low and inward at load, steady leg kick trigger. Quick hands, uphill bat path with an elevated attack angle. Flashed barrel feel and power to the pull-side.
Power: 86 mph exit velocity from the tee. Recorded a max FB distance of 339 ft, per TrackMan.
Arm: LH. OF - 79 mph. Long arm path, high 3/4 slot.
Defense: Athletic outfield actions. Quick first step, feet field in rhythm, works around the baseball. Soft hands, clean exchange to release. Clear confidence in himself defensively.
Run: 7.41 runner in the 60.