CLASS OF 2025
SS
2B
Kannon
Kamp
Father McGivney (HS) • IL
 5' 11" • 154.3LBS
L/R • 18yr 2mo
Travel Team: GBA
L/R • 18yr 2mo
Travel Team: GBA
Rankings
2025 National
Rankings available to Premium Subscriber
2025 State
Rankings available to Premium Subscriber
Commitment
Best Of Stats
19.3
Hand Speed (max)
8/08/23
64
Bat Speed (max)
8/08/23
8.6
Rot. Acc (max)
8/08/23
-
Hard Hit %
87.4
Exit Velocity (max)
2/11/24
79.6
Exit Velocity (avg)
2/11/24
284
Distance (max)
2/11/24
92
Sweet Spot %
8/08/23
7.2
60
8/08/23
4
30-yd
8/08/23
1.75
10-yd
2/11/23
19.2
Run speed (max)
8/08/23
84
INF Velo
2/11/24
-
OF Velo
-
C Velo
-
Pop Time
Fastball
84
Velocity (max)
2/11/24
83 - 84
Velo Range
2/11/24
2063
Spin Rate (avg)
8/08/23
Changeup
71.2 - 72.4
Velo Range
8/08/23
1806
Spin Rate (avg)
8/08/23
Curveball
71 - 72
Velo Range
2/11/24
-
Spin Rate (avg)
Slider
70 - 71
Velo Range
8/08/23
2133
Spin Rate (avg)
8/08/23
Positional Tools
2024
2023
2022
60 Yard Dash
The athlete's fastest 60-yard dash time in the given event year. Measured in seconds (s)
7.23
Infield Velocity
The athlete's maximum throwing velocity from an infield position in the given event year. Measured in miles per hour (MPH).
84.0
Power / Speed Score
A simple calculation that divides the athlete’s Exit Velocity Max by the athlete’s 60 Yard Dash time for the given event year. For example, 98 MPH / 7.00s = 14.00.
12.1
60 Yard Dash
The athlete's fastest 60-yard dash time in the given event year. Measured in seconds (s)
7.20
Infield Velocity
The athlete's maximum throwing velocity from an infield position in the given event year. Measured in miles per hour (MPH).
82.0
Power / Speed Score
A simple calculation that divides the athlete’s Exit Velocity Max by the athlete’s 60 Yard Dash time for the given event year. For example, 98 MPH / 7.00s = 14.00.
11.8
60 Yard Dash
The athlete's fastest 60-yard dash time in the given event year. Measured in seconds (s)
7.36
Infield Velocity
The athlete's maximum throwing velocity from an infield position in the given event year. Measured in miles per hour (MPH).
80.0
Power / Speed Score
A simple calculation that divides the athlete’s Exit Velocity Max by the athlete’s 60 Yard Dash time for the given event year. For example, 98 MPH / 7.00s = 14.00.
9.8
Hitting

2024
2023
Exit Velocity Max
The highest exit velocity of any batted ball in the given event year. Measured in miles per hour (MPH).
87.4
Exit Velocity Avg
Average exit velocity of all batted balls in the given event year. Measured in miles per hour (MPH).
79.6
Distance Max
The highest flight distance of any batted ball in the given event year. Measured in feet (ft).
284
Distance Avg
Average flight distance of all batted balls in the given event year. Measured in feet (ft).
195
Launch Angle Avg
Average launch angle of all batted balls in the given event year. Measured in degrees.
17.5
Hard Hit %
Percentage of batted balls with exit velocities over 95 MPH in the given event year.
Sweet Spot %
Percentage of batted balls in the given event year with a launch angle between 8° and 32°.
Line Drive %
Percentage of batted balls with launch angles between 10 and 25 degrees in the given event year.
Fly Ball %
Percentage of batted balls with launch angles between 25 and 50 degrees in the given event year.
Ground Ball %
Percentage of batted balls with launch angles below 10 degrees in the given event year.
Exit Velocity Max
The highest exit velocity of any batted ball in the given event year. Measured in miles per hour (MPH).
85.3
Exit Velocity Avg
Average exit velocity of all batted balls in the given event year. Measured in miles per hour (MPH).
74.8
Distance Max
The highest flight distance of any batted ball in the given event year. Measured in feet (ft).
264
Distance Avg
Average flight distance of all batted balls in the given event year. Measured in feet (ft).
209
Launch Angle Avg
Average launch angle of all batted balls in the given event year. Measured in degrees.
22.9
Hard Hit %
Percentage of batted balls with exit velocities over 95 MPH in the given event year.
Sweet Spot %
Percentage of batted balls in the given event year with a launch angle between 8° and 32°.
Line Drive %
Percentage of batted balls with launch angles between 10 and 25 degrees in the given event year.
Fly Ball %
Percentage of batted balls with launch angles between 25 and 50 degrees in the given event year.
Ground Ball %
Percentage of batted balls with launch angles below 10 degrees in the given event year.
GBA Scout Day 2024
Feb 11, 2024
Trackman - Hitting
87.4
Exit Velocity (max)
79.6
Exit Velocity (avg)
195
Distance (avg)
284
Distance (max)
Sweet Spot %
Line Drive %
Fly Ball %
Ground Ball %
Illinois State Games (Invite-Only)
Aug 8, 2023
Trackman - Hitting
80.7
Exit Velocity (max)
72.9
Exit Velocity (avg)
200
Distance (avg)
252
Distance (max)
Sweet Spot %
Line Drive %
Fly Ball %
GBA Scout Day 2023
Feb 11, 2023
Trackman - Hitting
85.3
Exit Velocity (max)
77.6
Exit Velocity (avg)
221
Distance (avg)
264
Distance (max)
Sweet Spot %
Line Drive %
Fly Ball %
Ground Ball %
Hitting

2023
Hand Speed Max
The highest Peak Hand Speed of any swing in the given event year.
19.3
Hand Speed Avg
The average Peak Hand Speed for all swings in the given event year.
18.4
Bat Speed Max
The highest Bat Speed of any swing in the given event year.
64.0
Bat Speed Avg
The average Bat Speed for all swings in the given event year.
61.5
Rotational Acceleration Max
The highest Rotational Acceleration of any swing in the given event year.
Rotational Acceleration Avg
The average Rotational Acceleration for all swings in the given event year.
On-Plane Efficiency Max
The highest On-Plane Efficiency of any swing in the given event year.
On-Plane Efficiency Avg
The average On-Plane Efficiency for all swings in the given event year.
Illinois State Games (Invite-Only)
Aug 8, 2023
Blast - Hitting
19.3
Hand Speed (max)
18.4
Hand Speed (avg)
64.0
Bat Speed (max)
61.5
Bat Speed (avg)
Rot. Acc (max)
Rot. Acc (avg)
On Plane Eff (avg)
MaxOnPlaneEfficiency
Pitching

2023
Fastball
Velocity Max
The maximum observed fastball velocity in the given event year. Measured in miles per hour (MPH).
83.7
Fastball
Velocity Avg
The average velocity for all pitches of this type in the given event year. Measured in miles per hour (MPH).
82.1
Fastball
Spin Rate Avg
The average rate of spin for all pitches of this type in the given event year. Measured in rotations per minute (RPM).
2063
Fastball
Spin Score Avg
The average Bauer Units value of all fastballs in the given event year. Bauer Units are calculated for each pitch by dividing Spin Rate by Velocity.
25.1
Fastball
Total Movement Avg
The average total non-gravity movement for all pitches of this type in the given event year. Measured in inches (in).
Changeup
Velocity Avg
The average velocity for all pitches of this type in the given event year. Measured in miles per hour (MPH).
71.8
Changeup
Spin Rate Avg
The average rate of spin for all pitches of this type in the given event year. Measured in rotations per minute (RPM).
1806
Changeup
Total Movement Avg
The average total non-gravity movement for all pitches of this type in the given event year. Measured in inches (in).
Slider
Velocity Avg
The average velocity for all pitches of this type in the given event year. Measured in miles per hour (MPH).
70.2
Slider
Spin Rate Avg
The average rate of spin for all pitches of this type in the given event year. Measured in rotations per minute (RPM).
2133
Slider
Total Movement Avg
The average total non-gravity movement for all pitches of this type in the given event year. Measured in inches (in).
Illinois State Games (Invite-Only)
Aug 8, 2023
Trackman - Fastball
83.7
Velocity (max)
81.2 - 83.1
Velo Range
82.0
Eff Velocity (avg)
2,226
Spin Rate (max)
2,063
Spin Rate (avg)
IVB (max)
IVB (avg)
HM (max)
HM (avg)
Extension (avg)
Release Ht (avg)
Spin Score (max)
Zone %
Spin Efficiency % (avg)
Trackman - Slider
71.0
Velocity (max)
69.7 - 70.9
Velo Range
68.9
Eff Velocity (avg)
2,198
Spin Rate (max)
2,133
Spin Rate (avg)
IVB (max)
IVB (avg)
HM (max)
HM (avg)
Extension (avg)
Release Ht (avg)
Spin Score (max)
Spin Efficiency % (avg)
Trackman - ChangeUp
73.1
Velocity (max)
71.2 - 72.4
Velo Range
71.3
Eff Velocity (avg)
2,006
Spin Rate (max)
1,806
Spin Rate (avg)
IVB (max)
IVB (avg)
HM (max)
HM (avg)
Extension (avg)
Release Ht (avg)
Spin Score (max)
Zone %
Spin Efficiency % (avg)
Pitch Scores
2023
Fastball
Hop+
A fastball with hop has a flat approach angle and visually jumps through the zone. When thrown up in the zone, it is more likely to generate a higher swing and miss average. Hop+ of 100 is MLB average.
Fastball
Sink+
A fastball with sink has low backspin and drops through the strike zone. When thrown down in the zone, it is more likely to generate a higher ground ball percentage and lower launch angle. Sink+ of 100 is MLB average.
Fastball
Rise+
A fastball with rise has a high percentage of backspin. When thrown up in the zone, it is more likely to generate a higher fly ball percentage. Rise+ of 100 is MLB average
Pitching Velos
2024
2023
2022
Fastball
Velocity Max
The maximum observed fastball velocity in the given event year. Measured in miles per hour (MPH).
84.0
Fastball
Velocity Avg
The average velocity for all pitches of this type in the given event year. Measured in miles per hour (MPH)
83.5
Curveball
Velocity Avg
The average velocity for all pitches of this type in the given event year. Measured in miles per hour (MPH)
71.5
Changeup
Velocity Avg
The average velocity for all pitches of this type in the given event year. Measured in miles per hour (MPH)
70.5
Fastball
Velocity Max
The maximum observed fastball velocity in the given event year. Measured in miles per hour (MPH).
84.0
Fastball
Velocity Avg
The average velocity for all pitches of this type in the given event year. Measured in miles per hour (MPH)
81.2
Changeup
Velocity Avg
The average velocity for all pitches of this type in the given event year. Measured in miles per hour (MPH)
71.2
Slider
Velocity Avg
The average velocity for all pitches of this type in the given event year. Measured in miles per hour (MPH)
68.0
Fastball
Velocity Max
The maximum observed fastball velocity in the given event year. Measured in miles per hour (MPH).
79.0
Fastball
Velocity Avg
The average velocity for all pitches of this type in the given event year. Measured in miles per hour (MPH)
78.0
Changeup
Velocity Avg
The average velocity for all pitches of this type in the given event year. Measured in miles per hour (MPH)
69.5
Slider
Velocity Avg
The average velocity for all pitches of this type in the given event year. Measured in miles per hour (MPH)
64.0
Game Performance

2024
2023
2022
RSi
The reactive strength index measurement of an athlete's explosiveness by comparing their jump height to the ground contact time in between their jumps. On a scale of 0-5.
Vertical Jump
A measure of any athlete's body strength and reach calculated from the flight time divided by the contact time.
10 Yard Dash
The athlete's fastest 0-10-yard split time in the given event year. Measured in seconds.
1.75
30 Yard Dash
The athlete's fastest 0-30-yard split time in the given event year. Measured in seconds.
4.00
60 Yard Dash
The athlete's fastest 0-60-yard time in the given event year. Measured in seconds.
7.20
Top Speed (MPH)
The athlete's fastest split time converted to miles per hour.
10 Yard Dash
The athlete's fastest 0-10-yard split time in the given event year. Measured in seconds.
1.95
30 Yard Dash
The athlete's fastest 0-30-yard split time in the given event year. Measured in seconds.
4.25
60 Yard Dash
The athlete's fastest 0-60-yard time in the given event year. Measured in seconds.
7.57
Top Speed (MPH)
The athlete's fastest split time converted to miles per hour.
Visual Edge

2023
Edge Score
The highest Edge Score within the given year. Edge Score is a comprehensive score that takes the core-six visual skills into account, providing an assessment of an athlete’s overall visual ability.
60.46
Pitch Ai

Notes
News
- Week 8 Games - May 9, 2024
- 2024 Preseason All-State, Upperclass: Preview - Feb 22, 2024
- GBA Scout Day Quick Hits: Pitchers & Two-Ways - Feb 14, 2024
- Illinois State Games: 2025 Pitcher Analysis - Oct 26, 2023
- Illinois State Games: 2025 Infielder Analysis - Oct 23, 2023
- Illinois State Games, Takeaways: 2025s - Aug 21, 2023
- Week 9 Games - May 18, 2023
- Inside the Illinois 2025 Rankings: Risers and Newcomers - May 18, 2023
- IHSA 1A & 2A Playoff Preview: Teams To Know - May 16, 2023
- Week 6 Games - Apr 25, 2023
- Week 5 Diamond Notes - Apr 21, 2023
Comments
Draft Reports
Contact
Premium Content Area
To unlock contact information, you need to purchase a ScoutPLUS subscription.
Purchase Subscription OR
Login
Physical
2023
Grip Strgth (LH)
Grip strength is a measure of a players bat control and ability to transfer power and speed during impact, measured in pounds of force generated; collected with elbow bent at 90 degrees.
Grip Strgth (RH)
Grip strength is a measure of a players bat control and ability to transfer power and speed during impact, measured in pounds of force generated; collected with elbow bent at 90 degrees.




 Sign in to view rankings
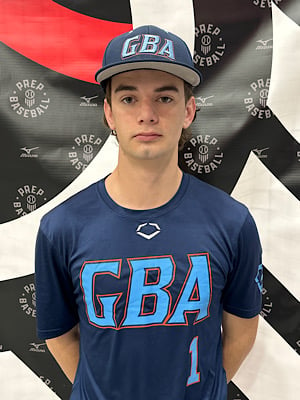
Uncommitted. Lean, wiry 5-foot-11, 155-pound left-handed hitter that started on the mound and hit in the two-hole for the Griffins; plays up the middle on the infield when he’s not pitching. Hitterish look, gives off the vibe that he’s going to get a hit each time he steps up to the plate. Short, simple, and direct path to contact with consistent barrel feel and polish. Widens his base with two strikes and shortens his load with two strikes, has an approach. Minimal swing-and-miss in our looks, has five strikeouts all season, and doesn’t expand the strike zone. Went 1-for-2, on the day with an RBI, two runs scored, and two walks, one of which was a double-digit pitch at-bat in the bottom of the seventh to get himself on base. Athletic on the mound, pitched in the low-80s with his fastball and flashed feel for a curveball/changeup secondary mix.
Showing an intriguing two-way look throughout the event was MIF/RHP Kannon Kamp (Father McGivney, 2025). The soon-to-be junior has been trending up in 2023 after hitting .407 for Father McGivney this past spring. Kamp continued that success into the summer, showing well in front of our staff at Creekside and now at the State Games. The left-handed hitter has a hitterish look in the box with a fluid swing that consistently finds barrels. During gameplay, Kamp used his all-fields approach to shoot a double the other way with two strikes. On the mound, Kamp showed a loose and whippy arm that generated natural arm-side run on a low-80s fastball. Playing off his heater, Kamp used a low-70s changeup with depth as an out-pitch. He’s a name-to-know prospect from southern Illinois in the 2025 class.
Positional Profile: SS/2B
Body: 5-10, 156-pounds.
Delivery: Stretch-only, up tempo, high leg lift, tall/fall, foot lands slightly closed. Did not allow a hit or walk in two innings of work and struck out three.
Arm Action: RH. 3/4 slot, full arm circle, acceleration out front.
FB: T84, 81-83 mph. Plays up, arm-side run, effective on the outside. T2226, 2063 average rpm.
SL: 70-71 mph. Short wrinkle, horizontal break. T2198, 2133 average rpm.
CH: 71-72 mph. Maintains arm speed, heavy fade, lands for strikes. T2006, 1806 average rpm.
Positional Profile: SS/2B
Hit: LHH. Wider stance, stock hand placement, medium/high leg kick. Simple, controlled approach, short to the ball, flat path, barrels at times, stays balanced through contact. Finished game play 3-for-7 with a double, RBI, run and walk. 61.5 mph bat speed with 8 G’s of rotational acceleration.
Power: 81 max exit velocity, averaged 72.9 mph. 252’ max distance.
Arm: RH. INF - 82 mph. Short, athletic arm, changes slots.
Defense: Sure-handed, athletic/fluid footwork, fields ball to body, clean double play turn.
Run: 7.20 runner in the 60.
Lean, athletic 5-foot-10, 155-pound frame with wiry strength. Left-handed bat that started at shortstop and hit sixth for Father McGivney in the win. Quiet at the plate with some rhythm pre-pitch, uses a simple hand turn to load and strides short. Loose, fluid, and easy left-handed swing, works direct to the baseball and doesn’t try to do too much. Flat level bat path that covers the plate. Sprayed a single to the opposite field and drew a walk in this look. Showed quality actions on the infield in I/O and between innings. Active feet that work around the baseball, soft glovework, works out front and funnels inward with a clean, quick release. Short arm action, comfortable from multiple arm angles. A presently polished sophomore with future upside that’s been producing on one of the state’s top high school programs all spring.
No. 7 Father McGivney went 5-0 last week, moving their record to 18-0 this season. In their five games played, Kamp went 9-for-12 (.750 BA/.800 OBP/.833 SLG/1.633 OPS) with a double, eight RBIs, nine runs scored, three walks, and two stolen bases. In their 31-0 win over Bunker Hill, Kamp went 3-for-3 with four RBIs, three runs scored, and a stolen base. He also threw two innings on the mound, struck out three, and earned the win in the combined no-hitter. He added two more hits with a double, two RBIs, three runs scored, and a walk in their 14-2 win over Bunker Hill. Rounding out their week, he went a perfect 2-for-2 with an RBI and a run scored In their 22-0 win over Maryville Christian.
Season Stats:
(.449 BA/.556 OBP/.486 SLG/1.042 OPS)
Lean, wiry 5-foot-10, 156-pound athlete. Started at shortstop and hit in the seven hole for the Griffins. Finished 3-for-3 with a double and four RBIs. Simple swing with rhythm, subtle load and controlled throughout. Works short and direct to the baseball, flat through the zone and covers the whole plate - two of his three hits went to left field. Competes, fouled several pitches off before flipping a two strike, two run single the other way in one of his at-bats. Slashing .465/.549/.512 on the year with 19 RBIs. Moved well around the dirt, looked the part with the glove in pre-game and in between innings. A left-handed hitting sophomore to follow with upside to all facets of his game.