CLASS OF 2023
RHP
Grant
Tenuta
University of Chicago
Sandburg (HS) • IL
6' 1" • 189LBS
R/R • 20yr
Travel Team: Cangelosi Sparks
Sandburg (HS) • IL
6' 1" • 189LBS
R/R • 20yr
Travel Team: Cangelosi Sparks
Rankings
2023 National
Rankings available to Premium Subscriber
2023 State
Rankings available to Premium Subscriber
Commitment
Best Of Stats
Fastball
90
Velocity (max)
2/26/22
88 - 90
Velo Range
2/26/22
2101
Spin Rate (avg)
2/26/22
Changeup
78 - 80
Velo Range
2/26/22
1531
Spin Rate (avg)
6/10/20
Curveball
71 - 73
Velo Range
2/26/22
1786
Spin Rate (avg)
2/26/22
Slider
75 - 76
Velo Range
7/21/22
-
Spin Rate (avg)
91.6
Exit Velocity (max)
6/10/20
79.6
Exit Velocity (avg)
6/10/20
324
Distance (max)
6/10/20
67
Sweet Spot %
6/10/20
-
Hand Speed (max)
-
Bat Speed (max)
-
Rot. Acc (max)
33
Hard Hit %
6/10/20
7.89
60
6/10/20
-
30-yd
-
10-yd
-
Run speed (max)
78
INF Velo
6/10/20
-
OF Velo
-
C Velo
-
Pop Time
Positional Tools
2020
60 Yard Dash
The athlete's fastest 60-yard dash time in the given event year. Measured in seconds (s)
7.89
Infield Velocity
The athlete's maximum throwing velocity from an infield position in the given event year. Measured in miles per hour (MPH).
78.0
Power / Speed Score
A simple calculation that divides the athlete’s Exit Velocity Max by the athlete’s 60 Yard Dash time for the given event year. For example, 98 MPH / 7.00s = 14.00.
11.6
Hitting

2020
Exit Velocity Max
The highest exit velocity of any batted ball in the given event year. Measured in miles per hour (MPH).
91.6
Exit Velocity Avg
Average exit velocity of all batted balls in the given event year. Measured in miles per hour (MPH).
79.6
Distance Max
The highest flight distance of any batted ball in the given event year. Measured in feet (ft).
324
Distance Avg
Average flight distance of all batted balls in the given event year. Measured in feet (ft).
164
Launch Angle Avg
Average launch angle of all batted balls in the given event year. Measured in degrees.
18.3
Hard Hit %
Percentage of batted balls with exit velocities over 95 MPH in the given event year.
Sweet Spot %
Percentage of batted balls in the given event year with a launch angle between 8° and 32°.
Line Drive %
Percentage of batted balls with launch angles between 10 and 25 degrees in the given event year.
Fly Ball %
Percentage of batted balls with launch angles between 25 and 50 degrees in the given event year.
Ground Ball %
Percentage of batted balls with launch angles below 10 degrees in the given event year.
Underclass Trials
Jun 10, 2020
Trackman - Hitting
91.6
Exit Velocity (max)
79.6
Exit Velocity (avg)
164
Distance (avg)
324
Distance (max)
Hard Hit %
Sweet Spot %
Line Drive %
Fly Ball %
Ground Ball %
Hitting

Pitching

2022
2021
2020
Fastball
Velocity Max
The maximum observed fastball velocity in the given event year. Measured in miles per hour (MPH).
89.8
Fastball
Velocity Avg
The average velocity for all pitches of this type in the given event year. Measured in miles per hour (MPH).
88.5
Fastball
Spin Rate Avg
The average rate of spin for all pitches of this type in the given event year. Measured in rotations per minute (RPM).
2101
Fastball
Spin Score Avg
The average Bauer Units value of all fastballs in the given event year. Bauer Units are calculated for each pitch by dividing Spin Rate by Velocity.
23.7
Fastball
Total Movement Avg
The average total non-gravity movement for all pitches of this type in the given event year. Measured in inches (in).
Curveball
Velocity Avg
The average velocity for all pitches of this type in the given event year. Measured in miles per hour (MPH).
72.2
Curveball
Spin Rate Avg
The average rate of spin for all pitches of this type in the given event year. Measured in rotations per minute (RPM).
1786
Curveball
Total Movement Avg
The average total non-gravity movement for all pitches of this type in the given event year. Measured in inches (in).
Changeup
Velocity Avg
The average velocity for all pitches of this type in the given event year. Measured in miles per hour (MPH).
78.5
Changeup
Spin Rate Avg
The average rate of spin for all pitches of this type in the given event year. Measured in rotations per minute (RPM).
1405
Changeup
Total Movement Avg
The average total non-gravity movement for all pitches of this type in the given event year. Measured in inches (in).
Fastball
Velocity Max
The maximum observed fastball velocity in the given event year. Measured in miles per hour (MPH).
88.7
Fastball
Velocity Avg
The average velocity for all pitches of this type in the given event year. Measured in miles per hour (MPH).
87.7
Fastball
Spin Rate Avg
The average rate of spin for all pitches of this type in the given event year. Measured in rotations per minute (RPM).
1972
Fastball
Spin Score Avg
The average Bauer Units value of all fastballs in the given event year. Bauer Units are calculated for each pitch by dividing Spin Rate by Velocity.
22.5
Fastball
Total Movement Avg
The average total non-gravity movement for all pitches of this type in the given event year. Measured in inches (in).
Curveball
Velocity Avg
The average velocity for all pitches of this type in the given event year. Measured in miles per hour (MPH).
70.2
Curveball
Spin Rate Avg
The average rate of spin for all pitches of this type in the given event year. Measured in rotations per minute (RPM).
1581
Curveball
Total Movement Avg
The average total non-gravity movement for all pitches of this type in the given event year. Measured in inches (in).
Changeup
Velocity Avg
The average velocity for all pitches of this type in the given event year. Measured in miles per hour (MPH).
75.9
Changeup
Spin Rate Avg
The average rate of spin for all pitches of this type in the given event year. Measured in rotations per minute (RPM).
1314
Changeup
Total Movement Avg
The average total non-gravity movement for all pitches of this type in the given event year. Measured in inches (in).
Fastball
Velocity Max
The maximum observed fastball velocity in the given event year. Measured in miles per hour (MPH).
84.7
Fastball
Velocity Avg
The average velocity for all pitches of this type in the given event year. Measured in miles per hour (MPH).
82.1
Fastball
Spin Rate Avg
The average rate of spin for all pitches of this type in the given event year. Measured in rotations per minute (RPM).
1715
Fastball
Spin Score Avg
The average Bauer Units value of all fastballs in the given event year. Bauer Units are calculated for each pitch by dividing Spin Rate by Velocity.
20.9
Fastball
Total Movement Avg
The average total non-gravity movement for all pitches of this type in the given event year. Measured in inches (in).
Curveball
Velocity Avg
The average velocity for all pitches of this type in the given event year. Measured in miles per hour (MPH).
68.1
Curveball
Spin Rate Avg
The average rate of spin for all pitches of this type in the given event year. Measured in rotations per minute (RPM).
1662
Curveball
Total Movement Avg
The average total non-gravity movement for all pitches of this type in the given event year. Measured in inches (in).
Changeup
Velocity Avg
The average velocity for all pitches of this type in the given event year. Measured in miles per hour (MPH).
69.6
Changeup
Spin Rate Avg
The average rate of spin for all pitches of this type in the given event year. Measured in rotations per minute (RPM).
1531
Changeup
Total Movement Avg
The average total non-gravity movement for all pitches of this type in the given event year. Measured in inches (in).
Preseason All-State: Upperclass (Invite-Only)
Feb 26, 2022
Trackman - Fastball
89.8
Velocity (max)
87.6 - 89.5
Velo Range
87.9
Eff Velocity (avg)
2,214
Spin Rate (max)
2,101
Spin Rate (avg)
IVB (max)
IVB (avg)
HM (max)
HM (avg)
Extension (avg)
Release Ht (avg)
Spin Score (max)
Zone %
Trackman - Curveball
73.4
Velocity (max)
71.3 - 73.0
Velo Range
70.5
Eff Velocity (avg)
1,896
Spin Rate (max)
1,786
Spin Rate (avg)
IVB (max)
IVB (avg)
HM (max)
HM (avg)
Extension (avg)
Release Ht (avg)
Spin Score (max)
Zone %
Trackman - ChangeUp
79.9
Velocity (max)
77.5 - 79.5
Velo Range
77.9
Eff Velocity (avg)
1,517
Spin Rate (max)
1,405
Spin Rate (avg)
IVB (max)
IVB (avg)
HM (max)
HM (avg)
Extension (avg)
Release Ht (avg)
Spin Score (max)
Zone %
2021 Future Games
Jul 28, 2021
Trackman - Fastball
87.7
Velocity (max)
83.3 - 86.3
Velo Range
83.3
Eff Velocity (avg)
2,066
Spin Rate (max)
1,567
Spin Rate (avg)
Spin Score (max)
Trackman - Curveball
75.4
Velocity (max)
67.2 - 73.7
Velo Range
68.8
Eff Velocity (avg)
1,570
Spin Rate (max)
1,387
Spin Rate (avg)
Spin Score (max)
Trackman - ChangeUp
76.6
Velocity (max)
75.5 - 76.5
Velo Range
74.5
Eff Velocity (avg)
1,164
Spin Rate (max)
1,047
Spin Rate (avg)
Spin Score (max)
Underclass Invitational (Invite Only)
Mar 27, 2021
Trackman - Fastball
88.7
Velocity (max)
86.9 - 88.5
Velo Range
85.9
Eff Velocity (avg)
2,072
Spin Rate (max)
1,972
Spin Rate (avg)
IVB (max)
IVB (avg)
HM (max)
HM (avg)
Extension (avg)
Release Ht (avg)
Spin Score (max)
Zone %
Trackman - Curveball
71.4
Velocity (max)
69.2 - 71.3
Velo Range
68.4
Eff Velocity (avg)
1,690
Spin Rate (max)
1,581
Spin Rate (avg)
IVB (max)
IVB (avg)
HM (max)
HM (avg)
Extension (avg)
Release Ht (avg)
Spin Score (max)
Zone %
Trackman - ChangeUp
76.8
Velocity (max)
75.0 - 76.7
Velo Range
74.4
Eff Velocity (avg)
1,414
Spin Rate (max)
1,314
Spin Rate (avg)
IVB (max)
IVB (avg)
HM (max)
HM (avg)
Extension (avg)
Release Ht (avg)
Spin Score (max)
Underclass Games (Invite Only)
Jul 21, 2020
Trackman - Fastball
84.7
Velocity (max)
80.8 - 83.9
Velo Range
80.9
Eff Velocity (avg)
2,001
Spin Rate (max)
1,636
Spin Rate (avg)
IVB (max)
IVB (avg)
HM (max)
HM (avg)
Extension (avg)
Release Ht (avg)
Spin Score (max)
Zone %
Trackman - Curveball
69.6
Velocity (max)
67.0 - 69.5
Velo Range
65.6
Eff Velocity (avg)
1,737
Spin Rate (max)
1,543
Spin Rate (avg)
IVB (max)
IVB (avg)
HM (max)
HM (avg)
Extension (avg)
Release Ht (avg)
Spin Score (max)
Zone %
Underclass Trials
Jun 10, 2020
Trackman - Fastball
82.5
Velocity (max)
80.6 - 82.0
Velo Range
79.6
Eff Velocity (avg)
2,049
Spin Rate (max)
1,985
Spin Rate (avg)
IVB (max)
IVB (avg)
HM (max)
HM (avg)
Extension (avg)
Release Ht (avg)
Spin Score (max)
Zone %
Trackman - Curveball
69.9
Velocity (max)
66.6 - 69.1
Velo Range
66.3
Eff Velocity (avg)
1,872
Spin Rate (max)
1,781
Spin Rate (avg)
IVB (max)
IVB (avg)
HM (max)
HM (avg)
Extension (avg)
Release Ht (avg)
Spin Score (max)
Zone %
Trackman - ChangeUp
71.6
Velocity (max)
68.2 - 71.0
Velo Range
68.1
Eff Velocity (avg)
1,642
Spin Rate (max)
1,531
Spin Rate (avg)
IVB (max)
IVB (avg)
HM (max)
HM (avg)
Extension (avg)
Release Ht (avg)
Spin Score (max)
Zone %
Pitch Scores
2021
2020
Fastball
Hop+
A fastball with hop has a flat approach angle and visually jumps through the zone. When thrown up in the zone, it is more likely to generate a higher swing and miss average. Hop+ of 100 is MLB average.
Fastball
Sink+
A fastball with sink has low backspin and drops through the strike zone. When thrown down in the zone, it is more likely to generate a higher ground ball percentage and lower launch angle. Sink+ of 100 is MLB average.
Fastball
Rise+
A fastball with rise has a high percentage of backspin. When thrown up in the zone, it is more likely to generate a higher fly ball percentage. Rise+ of 100 is MLB average
Curveball
Hammer+
A hammer breaking ball drops vertically with velocity through the zone, or 12-to-6 movement. Hammer+ of 100 is MLB average.
Curveball
Sweep+
A sweeping breaking ball moves horizontally with velocity through the zone. Sweep+ of 100 is MLB average.
Fastball
Hop+
A fastball with hop has a flat approach angle and visually jumps through the zone. When thrown up in the zone, it is more likely to generate a higher swing and miss average. Hop+ of 100 is MLB average.
Fastball
Sink+
A fastball with sink has low backspin and drops through the strike zone. When thrown down in the zone, it is more likely to generate a higher ground ball percentage and lower launch angle. Sink+ of 100 is MLB average.
Fastball
Rise+
A fastball with rise has a high percentage of backspin. When thrown up in the zone, it is more likely to generate a higher fly ball percentage. Rise+ of 100 is MLB average
Curveball
Hammer+
A hammer breaking ball drops vertically with velocity through the zone, or 12-to-6 movement. Hammer+ of 100 is MLB average.
Curveball
Sweep+
A sweeping breaking ball moves horizontally with velocity through the zone. Sweep+ of 100 is MLB average.
Pitching Velos
2023
2022
2021
2020
Fastball
Velocity Max
The maximum observed fastball velocity in the given event year. Measured in miles per hour (MPH).
89.0
Fastball
Velocity Avg
The average velocity for all pitches of this type in the given event year. Measured in miles per hour (MPH)
88.0
Curveball
Velocity Avg
The average velocity for all pitches of this type in the given event year. Measured in miles per hour (MPH)
72.0
Changeup
Velocity Avg
The average velocity for all pitches of this type in the given event year. Measured in miles per hour (MPH)
76.5
Fastball
Velocity Max
The maximum observed fastball velocity in the given event year. Measured in miles per hour (MPH).
90.0
Fastball
Velocity Avg
The average velocity for all pitches of this type in the given event year. Measured in miles per hour (MPH)
89.0
Curveball
Velocity Avg
The average velocity for all pitches of this type in the given event year. Measured in miles per hour (MPH)
72.0
Changeup
Velocity Avg
The average velocity for all pitches of this type in the given event year. Measured in miles per hour (MPH)
79.0
Fastball
Velocity Max
The maximum observed fastball velocity in the given event year. Measured in miles per hour (MPH).
89.0
Fastball
Velocity Avg
The average velocity for all pitches of this type in the given event year. Measured in miles per hour (MPH)
88.0
Curveball
Velocity Avg
The average velocity for all pitches of this type in the given event year. Measured in miles per hour (MPH)
70.0
Changeup
Velocity Avg
The average velocity for all pitches of this type in the given event year. Measured in miles per hour (MPH)
76.0
Fastball
Velocity Max
The maximum observed fastball velocity in the given event year. Measured in miles per hour (MPH).
86.0
Fastball
Velocity Avg
The average velocity for all pitches of this type in the given event year. Measured in miles per hour (MPH)
82.0
Curveball
Velocity Avg
The average velocity for all pitches of this type in the given event year. Measured in miles per hour (MPH)
68.0
Changeup
Velocity Avg
The average velocity for all pitches of this type in the given event year. Measured in miles per hour (MPH)
69.2
Game Performance

Visual Edge

Pitch Ai

2021
Arm Speed
The maximum speed, in the direction of home plate, that the wrist is traveling. Measured in meters per second (m/s)
Knee Extension Velo
The angular velocity of the front knee straightening after foot plant, which provides indicators of velocity potential. Measured in degrees per second.
Deception
The amount of time that the ball is visible to the hitter, after the instant of front foot strike. Measures in milliseconds.
Hip-Shoulder Separation
The difference in angle of between the hips and shoulders, occurring close to the foot plant. Measured in degrees.
IL/IN/IA/WI Workout Pod
Jul 28, 2021
ProPlayAI - Foot Plant
Elbow Flexion (avg)
Shoulder Abduction (avg)
Hip Shoulder Seperation (avg)
ProPlayAI - MER
External Rotation (avg)
Stride Length (avg)
Horizontal Abduction (avg)
ProPlayAI - Release
Arm Speed (max)
Arm Speed (avg)
Knee Extension Velocity (max)
Knee Extension Velocity (avg)
Knee Flexion (avg)
Lateral Trunk Tilt (avg)
Arm Path (avg)
Deception (avg)
Torque (avg)
Efficiency (avg)
Sequencing (avg)
Notes
News
- Week 5 Games - Apr 17, 2023
- Preseason All-State Upperclass: Pitcher Analysis - Jul 7, 2022
- Class of 2023 Rankings: Uncommitted Pitchers - Apr 26, 2022
- Preseason All-State: Upperclass TrackMan Files - Mar 7, 2022
- Preseason All-State: Upperclass Blast Motion Board - Mar 7, 2022
- Preseason All-State: Upperclass Statistical Analysis - Mar 4, 2022
- Preseason All-State: Upperclass Quick Hits - Mar 3, 2022
- IL Preseason All-State - Upperclass: Preview - Feb 23, 2022
- No. 24 Chicago Christian Walks Off Sandburg - May 20, 2021
- Week 4 Games - May 17, 2021
- Lincoln-Way West Scores Six Unanswered, Knocks Off Sandburg - May 6, 2021
- IL/WI Underclass Games: Pitcher Analysis - Oct 23, 2020
- 2023 Illinois Rankings: Deep Dive - Oct 14, 2020
- Illinois Fall Limited Series: Scout Blog - Oct 6, 2020
- PBR at The Rock Fall Championships: All-Underclass Teams - Sep 29, 2020
- Illinois Underclass Trials: Pitcher Analysis - Aug 27, 2020
- Illinois Underclass Trials: Infielder Analysis - Aug 26, 2020
- IL/WI Underclass Games: Takeaways - Jul 22, 2020
- Underclass Invitational: 2023 Pitcher Analysis - Apr 9, 2020
Comments
Draft Reports
Contact
Premium Content Area
To unlock contact information, you need to purchase a ScoutPLUS subscription.
Purchase Subscription OR
Login


 Sign in to view rankings
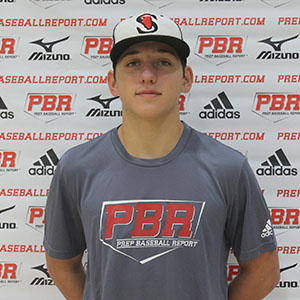
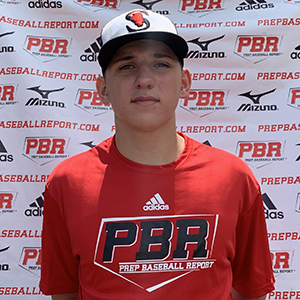
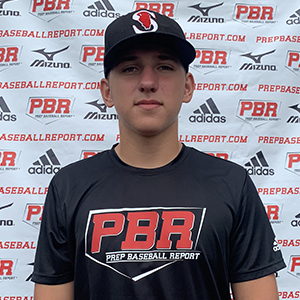
University of Chicago commit. Ranked No. 77 in Illinois Class of 2023. Strong, 6-foot-1, 189-pound build. Came in to pitch in the 6th inning and picked up a two inning save. Recorded three strikeouts and allowed one earned run in the short outing. Tenuta works in an uptempo stretch only delivery, drives off the back leg with a square footstrike. A three pitch mix comes from a short, quick arm action with a high 3/4 slot. The fastball comes clean out of the hand and plays mostly straight, sitting 87-89 mph through both innings. An 11/5 curveball backed the fastball with tight spin while staying in rhythm, sat 71-73 mph. And a changeup with late sinking action sat 76-77 mph.
Positional Profile: RHP
Body: 6-1, 188-pounds.
Delivery: Delivery works with tempo and rhythm, quick paced and repeatable, stays compact.
Arm Action: RH. Short plunge at separation, connected through release, high 3/4 slot.
FB: T89.8, 87.6-89.5 mph. Slight arm side run, above average control. T2214, 2101 average rpm.
CB: 71.3-73.0 mph. Short action, tighter shape, 11/5 plane. T1896, 1785 average rpm.
CH: 77.5-79.5 mph. Above average feel, hard sinking action. T1517, 1405 average rpm.
Tenuta was around the zone with his entire arsenal, including a fastball that sat 88-90 mph. His curveball played with short, tight action at 71-73 mph and his changeup sat 78-80 with above-average feel and late sinking action.
Positional Profile: RHP
Body: 6-1, 188-pounds. Strong build.
Delivery: Clean, repeatable tall and fall delivery, smooth tempo, lands square, works in line with target.
Arm Action: RH. Quick arm action, high 3/4 arm slot.
FB: T89, 87-89 mph. 4-seam, mostly straight, flashes a heavy ball, strikes. T2071, 1971 average rpm.
CB: 69-71 mph. 11/5 shape, sharp action, feel for strikes. T1690, 1580 average rpm.
CH: 75-77 mph. Advanced sink/fade action, thrown for strikes at bottom of zone. T1414, 1314 average rpm.
6-foot, 180-pound, well-proportioned, right-handed pitcher. Strength in lower half. Short, clean arm stroke, high ¾ slot. Delivery works on-line, lands square, finishes with intent. Fastball works mostly straight, touched 86 mph, sat 83-84 early. Curveball played in the upper-60's, 11/5 shape, lands for strikes. Should continue to sharpen up if thrown with more intent. If the trend of his older two brothers, Evan (Notre Dame) and Will (Purdue), holds true, Grant’s velocity will continue to tick up over the next few years.
Positional Profile: RHP/3B A power arm prospect who landed in the rankings on the state's initial '23 board.
Body: 6-0, 180-pounds. Athletic, well-proportioned frame with room to develop strength.
Delivery: Quick side-step initiates an athletic drop/drive type delivery, high leg kick to balance point, engaged lower half throughout motion, strong scap load at footstrike. Level shoulders, works linear to target, open-toed landing.
Arm Action: RH. Compact arm action, high 3/4 slot. Above-average arm speed for age.
FB: T85, 81-84 mph. Four-seam type with slight arm-side action when he stays behind; works around to cut it at times.
CB: 67-70 mph. 12/6 shape with some depth, gradual break. Sets up his fastball for success up in the zone.
CH: 68-71 mph. Fastball arm speed and intent; showed natural sinking action, feel for pitch.
Positional Profile: RHP/1B
Body: 6-0, 180-pounds. Proportional strength in athletic frame.
Delivery: Squared start from the center of the rubber; fluid side step to athletic high knee balance point. Lead leg drops down and out to slightly open landing. Athletic finish, in control, some effort involved.
Arm Action: Arm circle is compact, short, from a high 3/4 slot with present arm speed.
FB: T82, 80-81 mph. Mostly straight with some arm-side action.
CB: 66-69 mph. Short wrinkle off 11/5 plane.
CH: 68-71 mph. Slight deceleration with some fade/run.
Hit: RHH. Balanced, wide setup, hands set high with vertical bathead. Loads back with demonstrable leg kick. Long path to contact off a level, flat plane.
Power: 83 mph exit velocity from the tee.
Arm: INF - 78 mph. Short, loose throws from high 3/4 slot; quick arm action produces carry across the infield.
Defense: Ranges athletically around the first base bag with feel for the base.
Run: 7.89 runner in the 60.
Positional Profile: RHP
Body: 6-foot, 170-pounds. Strong, well-proportioned build.
Delivery: Tall/fall type delivery, level shoulders, lands open to target, works quick with some rhythm.
Arm Action: RH. Short arm action, high 3/4 slot.
FB: T84, 81-82 mph. Primarily played straight, flashed arm-side run.
CB: 67-69 mph. 11/5 shape, slight deceleration in arm action.
CH: 68-70 mph. Showed arm-side run and sink.