CLASS OF 2025
SS
Brady
Green
Oak Park-River Forest (HS) • IL
5' 11" • 167LBS
R/R • 18yr 1mo
Travel Team: Strikes Baseball Club/Chicago Hustle
5' 11" • 167LBS
R/R • 18yr 1mo
Travel Team: Strikes Baseball Club/Chicago Hustle
Rankings
2025 National
Rankings available to Premium Subscriber
2025 State
Rankings available to Premium Subscriber
Commitment
Best Of Stats
22.6
Hand Speed (max)
2/24/24
79
Bat Speed (max)
7/26/23
17.4
Rot. Acc (max)
2/20/23
78
Hard Hit %
2/24/24
99.3
Exit Velocity (max)
2/20/23
92.4
Exit Velocity (avg)
2/24/24
355
Distance (max)
2/20/23
89
Sweet Spot %
2/24/24
6.94
60
8/08/23
3.88
30-yd
8/08/23
1.71
10-yd
8/08/23
20.1
Run speed (max)
8/08/23
90
INF Velo
2/24/24
-
OF Velo
-
C Velo
-
Pop Time
Fastball
83
Velocity (max)
6/22/23
78 - 82
Velo Range
7/07/22
-
Spin Rate (avg)
Changeup
74 - 76
Velo Range
7/07/22
-
Spin Rate (avg)
Curveball
65 - 67
Velo Range
6/22/23
-
Spin Rate (avg)
Positional Tools
2024
2023
2022
2021
60 Yard Dash
The athlete's fastest 60-yard dash time in the given event year. Measured in seconds (s)
7.05
Infield Velocity
The athlete's maximum throwing velocity from an infield position in the given event year. Measured in miles per hour (MPH).
90.0
Power / Speed Score
A simple calculation that divides the athlete’s Exit Velocity Max by the athlete’s 60 Yard Dash time for the given event year. For example, 98 MPH / 7.00s = 14.00.
13.8
60 Yard Dash
The athlete's fastest 60-yard dash time in the given event year. Measured in seconds (s)
6.94
Infield Velocity
The athlete's maximum throwing velocity from an infield position in the given event year. Measured in miles per hour (MPH).
86.0
Power / Speed Score
A simple calculation that divides the athlete’s Exit Velocity Max by the athlete’s 60 Yard Dash time for the given event year. For example, 98 MPH / 7.00s = 14.00.
14.3
60 Yard Dash
The athlete's fastest 60-yard dash time in the given event year. Measured in seconds (s)
7.31
Infield Velocity
The athlete's maximum throwing velocity from an infield position in the given event year. Measured in miles per hour (MPH).
82.0
Power / Speed Score
A simple calculation that divides the athlete’s Exit Velocity Max by the athlete’s 60 Yard Dash time for the given event year. For example, 98 MPH / 7.00s = 14.00.
12.6
60 Yard Dash
The athlete's fastest 60-yard dash time in the given event year. Measured in seconds (s)
7.67
Infield Velocity
The athlete's maximum throwing velocity from an infield position in the given event year. Measured in miles per hour (MPH).
77.0
Power / Speed Score
A simple calculation that divides the athlete’s Exit Velocity Max by the athlete’s 60 Yard Dash time for the given event year. For example, 98 MPH / 7.00s = 14.00.
11.1
Hitting

2024
2023
2022
2021
Exit Velocity Max
The highest exit velocity of any batted ball in the given event year. Measured in miles per hour (MPH).
97.1
Exit Velocity Avg
Average exit velocity of all batted balls in the given event year. Measured in miles per hour (MPH).
92.4
Distance Max
The highest flight distance of any batted ball in the given event year. Measured in feet (ft).
354
Distance Avg
Average flight distance of all batted balls in the given event year. Measured in feet (ft).
318
Launch Angle Avg
Average launch angle of all batted balls in the given event year. Measured in degrees.
25.0
Hard Hit %
Percentage of batted balls with exit velocities over 95 MPH in the given event year.
Sweet Spot %
Percentage of batted balls in the given event year with a launch angle between 8° and 32°.
Line Drive %
Percentage of batted balls with launch angles between 10 and 25 degrees in the given event year.
Fly Ball %
Percentage of batted balls with launch angles between 25 and 50 degrees in the given event year.
Ground Ball %
Percentage of batted balls with launch angles below 10 degrees in the given event year.
Exit Velocity Max
The highest exit velocity of any batted ball in the given event year. Measured in miles per hour (MPH).
99.3
Exit Velocity Avg
Average exit velocity of all batted balls in the given event year. Measured in miles per hour (MPH).
88.2
Distance Max
The highest flight distance of any batted ball in the given event year. Measured in feet (ft).
355
Distance Avg
Average flight distance of all batted balls in the given event year. Measured in feet (ft).
201
Launch Angle Avg
Average launch angle of all batted balls in the given event year. Measured in degrees.
17.0
Hard Hit %
Percentage of batted balls with exit velocities over 95 MPH in the given event year.
Sweet Spot %
Percentage of batted balls in the given event year with a launch angle between 8° and 32°.
Line Drive %
Percentage of batted balls with launch angles between 10 and 25 degrees in the given event year.
Fly Ball %
Percentage of batted balls with launch angles between 25 and 50 degrees in the given event year.
Ground Ball %
Percentage of batted balls with launch angles below 10 degrees in the given event year.
Exit Velocity Max
The highest exit velocity of any batted ball in the given event year. Measured in miles per hour (MPH).
92.1
Exit Velocity Avg
Average exit velocity of all batted balls in the given event year. Measured in miles per hour (MPH).
75.7
Distance Max
The highest flight distance of any batted ball in the given event year. Measured in feet (ft).
277
Distance Avg
Average flight distance of all batted balls in the given event year. Measured in feet (ft).
192
Launch Angle Avg
Average launch angle of all batted balls in the given event year. Measured in degrees.
22.1
Hard Hit %
Percentage of batted balls with exit velocities over 95 MPH in the given event year.
Sweet Spot %
Percentage of batted balls in the given event year with a launch angle between 8° and 32°.
Line Drive %
Percentage of batted balls with launch angles between 10 and 25 degrees in the given event year.
Fly Ball %
Percentage of batted balls with launch angles between 25 and 50 degrees in the given event year.
Ground Ball %
Percentage of batted balls with launch angles below 10 degrees in the given event year.
Exit Velocity Max
The highest exit velocity of any batted ball in the given event year. Measured in miles per hour (MPH).
84.9
Exit Velocity Avg
Average exit velocity of all batted balls in the given event year. Measured in miles per hour (MPH).
78.2
Distance Max
The highest flight distance of any batted ball in the given event year. Measured in feet (ft).
306
Distance Avg
Average flight distance of all batted balls in the given event year. Measured in feet (ft).
223
Launch Angle Avg
Average launch angle of all batted balls in the given event year. Measured in degrees.
24.5
Hard Hit %
Percentage of batted balls with exit velocities over 95 MPH in the given event year.
Sweet Spot %
Percentage of batted balls in the given event year with a launch angle between 8° and 32°.
Line Drive %
Percentage of batted balls with launch angles between 10 and 25 degrees in the given event year.
Fly Ball %
Percentage of batted balls with launch angles between 25 and 50 degrees in the given event year.
Ground Ball %
Percentage of batted balls with launch angles below 10 degrees in the given event year.
Preseason All-State: Upperclass (Invite-Only)
Feb 24, 2024
Trackman - Hitting
97.1
Exit Velocity (max)
92.4
Exit Velocity (avg)
318
Distance (avg)
354
Distance (max)
Hard Hit %
Sweet Spot %
Line Drive %
Fly Ball %
Illinois State Games (Invite-Only)
Aug 8, 2023
Trackman - Hitting
98.8
Exit Velocity (max)
91.3
Exit Velocity (avg)
232
Distance (avg)
350
Distance (max)
Hard Hit %
Sweet Spot %
Line Drive %
Fly Ball %
Ground Ball %
2023 PBR Future Games
Jul 26, 2023
Trackman - Hitting
97.1
Exit Velocity (max)
87.1
Exit Velocity (avg)
207
Distance (avg)
316
Distance (max)
Hard Hit %
Sweet Spot %
Line Drive %
Fly Ball %
Ground Ball %
FG Workout IL/IN/MDW/WI
Jul 26, 2023
Trackman - Hitting
97.1
Exit Velocity (max)
87.1
Exit Velocity (avg)
207
Distance (avg)
316
Distance (max)
Hard Hit %
Sweet Spot %
Line Drive %
Fly Ball %
Ground Ball %
Preseason All-State: Underclass (Invite-Only)
Feb 25, 2023
Trackman - Hitting
91.0
Exit Velocity (max)
83.2
Exit Velocity (avg)
166
Distance (avg)
282
Distance (max)
Hard Hit %
Sweet Spot %
Line Drive %
Fly Ball %
Ground Ball %
Lockport Preseason ID
Feb 20, 2023
Trackman - Hitting
99.3
Exit Velocity (max)
90.3
Exit Velocity (avg)
190
Distance (avg)
355
Distance (max)
Hard Hit %
Sweet Spot %
Line Drive %
Fly Ball %
Ground Ball %
Illinois State Games (Invite-Only)
Aug 9, 2022
Trackman - Hitting
89.1
Exit Velocity (max)
73.0
Exit Velocity (avg)
164
Distance (avg)
268
Distance (max)
Sweet Spot %
Line Drive %
Fly Ball %
Ground Ball %
Preseason All-State: Underclass (Invite-Only)
Feb 26, 2022
Trackman - Hitting
92.1
Exit Velocity (max)
78.4
Exit Velocity (avg)
220
Distance (avg)
277
Distance (max)
Hard Hit %
Sweet Spot %
Line Drive %
Fly Ball %
Ground Ball %
Underclass Showcase
Oct 17, 2021
Trackman - Hitting
83.7
Exit Velocity (max)
77.6
Exit Velocity (avg)
229
Distance (avg)
292
Distance (max)
Sweet Spot %
Line Drive %
Fly Ball %
Ground Ball %
2025 Future Prospect Games (Invite Only)
Jul 7, 2021
Trackman - Hitting
84.9
Exit Velocity (max)
78.8
Exit Velocity (avg)
215
Distance (avg)
306
Distance (max)
Sweet Spot %
Line Drive %
Fly Ball %
Ground Ball %
Hitting

2024
2023
2022
2021
Hand Speed Max
The highest Peak Hand Speed of any swing in the given event year.
22.6
Hand Speed Avg
The average Peak Hand Speed for all swings in the given event year.
21.4
Bat Speed Max
The highest Bat Speed of any swing in the given event year.
70.1
Bat Speed Avg
The average Bat Speed for all swings in the given event year.
68.6
Rotational Acceleration Max
The highest Rotational Acceleration of any swing in the given event year.
Rotational Acceleration Avg
The average Rotational Acceleration for all swings in the given event year.
On-Plane Efficiency Max
The highest On-Plane Efficiency of any swing in the given event year.
On-Plane Efficiency Avg
The average On-Plane Efficiency for all swings in the given event year.
Hand Speed Max
The highest Peak Hand Speed of any swing in the given event year.
21.6
Hand Speed Avg
The average Peak Hand Speed for all swings in the given event year.
20.2
Bat Speed Max
The highest Bat Speed of any swing in the given event year.
79.0
Bat Speed Avg
The average Bat Speed for all swings in the given event year.
68.3
Rotational Acceleration Max
The highest Rotational Acceleration of any swing in the given event year.
Rotational Acceleration Avg
The average Rotational Acceleration for all swings in the given event year.
On-Plane Efficiency Max
The highest On-Plane Efficiency of any swing in the given event year.
On-Plane Efficiency Avg
The average On-Plane Efficiency for all swings in the given event year.
Hand Speed Max
The highest Peak Hand Speed of any swing in the given event year.
22.1
Hand Speed Avg
The average Peak Hand Speed for all swings in the given event year.
20.0
Bat Speed Max
The highest Bat Speed of any swing in the given event year.
69.3
Bat Speed Avg
The average Bat Speed for all swings in the given event year.
62.3
Rotational Acceleration Max
The highest Rotational Acceleration of any swing in the given event year.
Rotational Acceleration Avg
The average Rotational Acceleration for all swings in the given event year.
On-Plane Efficiency Max
The highest On-Plane Efficiency of any swing in the given event year.
On-Plane Efficiency Avg
The average On-Plane Efficiency for all swings in the given event year.
Hand Speed Max
The highest Peak Hand Speed of any swing in the given event year.
22.3
Hand Speed Avg
The average Peak Hand Speed for all swings in the given event year.
20.3
Bat Speed Max
The highest Bat Speed of any swing in the given event year.
69.1
Bat Speed Avg
The average Bat Speed for all swings in the given event year.
64.3
Rotational Acceleration Max
The highest Rotational Acceleration of any swing in the given event year.
Rotational Acceleration Avg
The average Rotational Acceleration for all swings in the given event year.
On-Plane Efficiency Max
The highest On-Plane Efficiency of any swing in the given event year.
On-Plane Efficiency Avg
The average On-Plane Efficiency for all swings in the given event year.
Preseason All-State: Upperclass (Invite-Only)
Feb 24, 2024
Blast - Hitting
22.6
Hand Speed (max)
21.4
Hand Speed (avg)
70.1
Bat Speed (max)
68.6
Bat Speed (avg)
Rot. Acc (max)
Rot. Acc (avg)
On Plane Eff (avg)
MaxOnPlaneEfficiency
2023 PBR Future Games
Jul 26, 2023
Blast - Hitting
21.4
Hand Speed (max)
20.6
Hand Speed (avg)
79.0
Bat Speed (max)
69.5
Bat Speed (avg)
Rot. Acc (max)
Rot. Acc (avg)
On Plane Eff (avg)
MaxOnPlaneEfficiency
Preseason All-State: Underclass (Invite-Only)
Feb 25, 2023
Blast - Hitting
20.6
Hand Speed (max)
19.0
Hand Speed (avg)
72.2
Bat Speed (max)
67.1
Bat Speed (avg)
Rot. Acc (max)
Rot. Acc (avg)
On Plane Eff (avg)
MaxOnPlaneEfficiency
Lockport Preseason ID
Feb 20, 2023
Blast - Hitting
21.6
Hand Speed (max)
20.8
Hand Speed (avg)
69.8
Bat Speed (max)
66.7
Bat Speed (avg)
Rot. Acc (max)
Rot. Acc (avg)
On Plane Eff (avg)
MaxOnPlaneEfficiency
Illinois State Games (Invite-Only)
Aug 9, 2022
Blast - Hitting
20.2
Hand Speed (max)
19.5
Hand Speed (avg)
65.5
Bat Speed (max)
59.6
Bat Speed (avg)
Rot. Acc (max)
Rot. Acc (avg)
On Plane Eff (avg)
MaxOnPlaneEfficiency
Preseason All-State: Underclass (Invite-Only)
Feb 26, 2022
Blast - Hitting
22.1
Hand Speed (max)
20.6
Hand Speed (avg)
69.3
Bat Speed (max)
65.7
Bat Speed (avg)
Rot. Acc (max)
Rot. Acc (avg)
On Plane Eff (avg)
MaxOnPlaneEfficiency
Underclass Showcase
Oct 17, 2021
Blast - Hitting
22.3
Hand Speed (max)
20.9
Hand Speed (avg)
68.0
Bat Speed (max)
64.7
Bat Speed (avg)
Rot. Acc (max)
Rot. Acc (avg)
On Plane Eff (avg)
MaxOnPlaneEfficiency
2025 Future Prospect Games (Invite Only)
Jul 7, 2021
Blast - Hitting
20.9
Hand Speed (max)
19.8
Hand Speed (avg)
69.1
Bat Speed (max)
63.9
Bat Speed (avg)
Rot. Acc (max)
Rot. Acc (avg)
On Plane Eff (avg)
MaxOnPlaneEfficiency
Pitching

Pitch Scores
Pitching Velos
2023
2022
Fastball
Velocity Max
The maximum observed fastball velocity in the given event year. Measured in miles per hour (MPH).
83.0
Fastball
Velocity Avg
The average velocity for all pitches of this type in the given event year. Measured in miles per hour (MPH)
79.5
Curveball
Velocity Avg
The average velocity for all pitches of this type in the given event year. Measured in miles per hour (MPH)
66.0
Fastball
Velocity Max
The maximum observed fastball velocity in the given event year. Measured in miles per hour (MPH).
82.0
Fastball
Velocity Avg
The average velocity for all pitches of this type in the given event year. Measured in miles per hour (MPH)
80.0
Curveball
Velocity Avg
The average velocity for all pitches of this type in the given event year. Measured in miles per hour (MPH)
65.5
Changeup
Velocity Avg
The average velocity for all pitches of this type in the given event year. Measured in miles per hour (MPH)
75.0
Game Performance

2024
2023
2022
RSi
The reactive strength index measurement of an athlete's explosiveness by comparing their jump height to the ground contact time in between their jumps. On a scale of 0-5.
Vertical Jump
A measure of any athlete's body strength and reach calculated from the flight time divided by the contact time.
10 Yard Dash
The athlete's fastest 0-10-yard split time in the given event year. Measured in seconds.
1.71
30 Yard Dash
The athlete's fastest 0-30-yard split time in the given event year. Measured in seconds.
3.88
60 Yard Dash
The athlete's fastest 0-60-yard time in the given event year. Measured in seconds.
6.94
Top Speed (MPH)
The athlete's fastest split time converted to miles per hour.
RSi
The reactive strength index measurement of an athlete's explosiveness by comparing their jump height to the ground contact time in between their jumps. On a scale of 0-5.
Vertical Jump
A measure of any athlete's body strength and reach calculated from the flight time divided by the contact time.
Preseason All-State: Underclass (Invite-Only)
Feb 25, 2023
Swift
1.86
10-yd
4.04
30-yd
7.14
60-yd
19.8
Run speed (max)
2.41
RSi (max)
2.41
RSi (avg)
1,611
Jump Power (max)
31.0
Jump Height (max)
30.1
Jump Height (avg)
Lockport Preseason ID
Feb 20, 2023
Swift
1.74
10-yd
3.94
30-yd
7.02
60-yd
19.9
Run speed (max)
2.57
RSi (max)
2.57
RSi (avg)
941
Jump Power (max)
Illinois State Games (Invite-Only)
Aug 9, 2022
Swift
1.76
10-yd
4.04
30-yd
7.31
60-yd
18.8
Run speed (max)
8.2
Run Speed (avg)
2.43
RSi (max)
3.01
RSi (avg)
1,580
Jump Power (max)
30.4
Jump Height (max)
29.8
Jump Height (avg)
Visual Edge

2024
2023
2022
2021
Edge Score
The highest Edge Score within the given year. Edge Score is a comprehensive score that takes the core-six visual skills into account, providing an assessment of an athlete’s overall visual ability.
73.42
Edge Score
The highest Edge Score within the given year. Edge Score is a comprehensive score that takes the core-six visual skills into account, providing an assessment of an athlete’s overall visual ability.
78.65
Edge Score
The highest Edge Score within the given year. Edge Score is a comprehensive score that takes the core-six visual skills into account, providing an assessment of an athlete’s overall visual ability.
73.61
Edge Score
The highest Edge Score within the given year. Edge Score is a comprehensive score that takes the core-six visual skills into account, providing an assessment of an athlete’s overall visual ability.
69.32
Pitch Ai

Notes
News
- Rock Summer Championship 17U: Takeaways - Aug 1, 2024
- 2024 Metro East Kickoff Classic: Scout Blog - Mar 24, 2024
- 2024 Preseason All-State, Upperclass: Takeaways - Feb 29, 2024
- 2024 Preseason All-State, Upperclass: Data Dive - Feb 29, 2024
- 2024 Preseason All-State, Upperclass: Preview - Feb 22, 2024
- Q&A With Northern Illinois Commit Brady Green - Feb 9, 2024
- Illinois State Games: Top 2025 Prospects - Oct 31, 2023
- Illinois State Games: 2025 Infielder Analysis - Oct 23, 2023
- PBRT Illinois Fall Open: Takeaways - Oct 6, 2023
- Illinois State Games, Takeaways: 2025s - Aug 21, 2023
- Team Illinois: Takeaways - Aug 1, 2023
- Team Illinois: Workout Day, Quick Hits - Jul 27, 2023
- 2023 Future Games Preview: Team Illinois - Jul 24, 2023
- Preseason All-State Underclass: Top Overall Prospects - May 19, 2023
- Inside the Illinois 2025 Rankings: Risers and Newcomers - May 18, 2023
- Preseason All-State Underclass: Infield Analysis - May 18, 2023
- Lockport Preseason ID: Top Overall Prospects - May 5, 2023
- Lockport Preseason ID: Infield Analysis - May 4, 2023
- Preseason Power 25 Countdown: No. 12 Oak Park-River Forest - Mar 10, 2023
- Preseason All State, Underclass: Quick Hits - Mar 1, 2023
- Lockport Preseason ID: Quick Hits - Feb 24, 2023
- Preseason All-State, Underclass: Preview - Feb 23, 2023
- Lockport Preseason ID: Preview - Feb 17, 2023
- Illinois Class of 2025 Rankings Update - Aug 31, 2022
- Illinois State Games: Takeaways - Aug 15, 2022
- Preseason All-State Underclass: Infield Analysis - Jul 7, 2022
- Underclass Showcase: Infield Analysis - Mar 29, 2022
- Preseason All-State: Underclass Quick Hits - Mar 1, 2022
- 2025 Future Prospect Games: Position Player Analysis - Dec 6, 2021
- McCook Future Prospects Showcase: Player Analysis - Sep 20, 2021
Comments
Draft Reports
Contact
Premium Content Area
To unlock contact information, you need to purchase a ScoutPLUS subscription.
Purchase Subscription OR
Login
Physical
2023
Grip Strgth (LH)
Grip strength is a measure of a players bat control and ability to transfer power and speed during impact, measured in pounds of force generated; collected with elbow bent at 90 degrees.
Grip Strgth (RH)
Grip strength is a measure of a players bat control and ability to transfer power and speed during impact, measured in pounds of force generated; collected with elbow bent at 90 degrees.

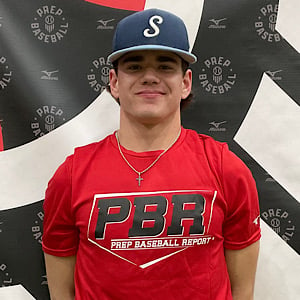

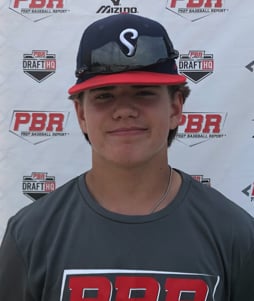
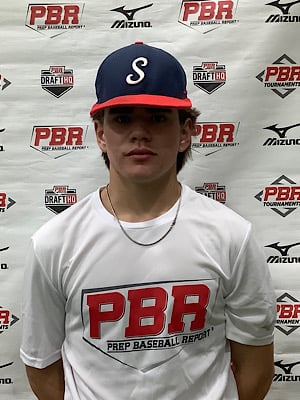


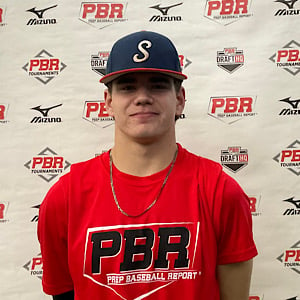


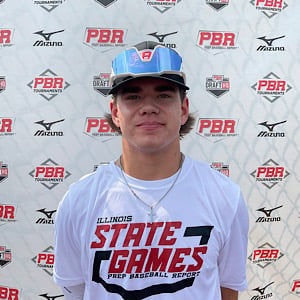


 Sign in to view rankings
Northern Illinois commit. An impressive week for the Wolfpack securing wins over Lockport and De La Salle, and Green was a huge help in that. He went 6-for-9 with a home run, two triples, six RBIS, five runs scored, slashing .727 OBP/2.283 OPS/1.1556 SLG. In their 14-4 win over Lockport, Green went 3-for-4 with a home run, double, four RBIs and three runs scored. He rounded out his week going 2-for-3 with two doubles, two RBIs and two runs scored in their 12-7 win over De La Salle.
Northern Illinois commit, and currently ranked No. 40 in the state, Green went 2-for-4 with a home run, one RBI, and two runs scored out of the cleanup spot for the Huskies. The recent Future Games alum sent a long home run out to left field in his final at-bat of the day to go as insurance for the Huskies entering the final frame.
INF Brady Green (Oak Park-River Forest, 2025; Northern Illinois commit) posted the highest average batted distance (299 feet) of the entire event, swatting his furthest ball 354 feet, per TrackMan. Green consistently produced hard contact in BP, as seven of his swings in BP produced 90+ mph exit velocities with a high mark at 97.1 mph. Green’s 90 mph high across the infield also tied for the top spot at this event.
Green, a former Future Games participant, creates impressive power with his intentful right-handed stroke; reaching up to 97.1 mph for his max EV with an average distance of 299’ (T354’). He also took one of the better rounds of defense on the infield, boasting athletic actions with a quick first step, playing with range to both sides of his glove to pair with a strong arm that can play on the run (T90 mph). 6.94 runner in the 60, also recorded a 31” vertical jump.
INF Brady Green (Oak Park-River Forest, 2025) is a recent PBR Future Games participant who played well all weekend in front of our staff. Green is currently uncommitted and stands in at a well-built 5-foot-11, 170-pounds with present strength throughout his frame. The right-handed hitter showed the ability to make loud contact to all fields; quick barrel through the zone with a flat path, uses the ground through impact. Defensively, Green primarily played up the middle in the infield and showed to be sure-handed with a strong arm to pair. His arm-strength translated over to the mound as well, cruising around 81-82 mph out of the ‘pen for the Hustle with a breaking ball in the mid-60s.
Fresh off representing Team Illinois at the PBR Future Games, INF Brady Green (Oak Park-River Forest, 2025) showed well again at this event. The 5-foot-11, 170-pound strong-bodied Green continued to swing a physical right-handed barrel, averaging 91.3 mph per batted ball, while reaching 98.8 mph at peak to pair with a 350 ft. max batted distance. Green almost exclusively elevated the baseball (80%) and stayed on his barrel throughout (70%), too. He ran a personal best 6.94 60, topped at 84 mph across the infield, and doubled during the event’s gameplay portion.
Positional Profile: SS/OF
Body: 5-11, 170-pounds. Continues to add quality muscle throughout.
Hit: RHH. Upright setup, high leg kick into forward move, lower half coil. Quick, controlled aggression swing, slightly uphill, consistently barreled the ball.
Power: 99 max exit velocity, averaged 91.3 mph. 350’ max distance.
Arm: RH. INF - 84 mph. Long, loose, 3/4 slot with carry on throws.
Defense: Soft, easy hands, moves well to both sides.
Run: 6.94 runner in the 60.
INF Brady Green (Oak Park-River Forest) is another high-motor player with physicality to know on Team Illinois. Green, who’s built at a strong, compact 5-foot-11, 170-pounds, squared up one of the hardest balls in BP (97.1 mph) of all Team Illinois’ players during Wednesday’s workout. His best showing offensively was against Pennsylvania in game one, where he doubled down the left field line and scored a run, while also posting a 4.37 down the line on a groundout. We’ve long known Green as a quality defender too and this week was no different, as he moved around the infield fluidly with steady glovework to pair.
INF Brady Green (Oak Park-River Forest, 2025) is a 5-foot-11, 170-pound, right-handed hitter with broad-shoulders and developing strength throughout. Green ran a 7.02 60 and took aggressive, intentful hacks during BP, registering a 97.1 mph max exit velocity with an 87.1 mph average. Green's bat stays in the zone and long time with present hand strength and occasional leverage to the pull side. Defensively, he is a steady, sound defender who can play on the move and he topped at 84 mph across the infield.
PBR Future Games: INF Brady Green (Oak Park-River Forest, 2025) is a 5-foot-11, 170-pound, right-handed hitter with broad-shoulders and developing strength throughout. Green ran a 7.02 60 and took aggressive, intentful hacks during BP, registering a 97.1 mph max exit velocity with an 87.1 mph average. Green's bat stays in the zone and long time with present hand strength and occasional leverage to the pull side. Defensively, he is a steady, sound defender who can play on the move and he topped at 84 mph across the infield.
Listed at an athletic and strong 5-foot-10, 170-pounds, Green was all over the barrel throughout the weekend for Strikes Baseball. Friday was the epitome of how Green’s weekend went as he tallied two hits, which included a deep double to left-center field to help Strikes to a win. Not only did his strong right-handed bat impress but his glove on the infield was arguably even more noteworthy. Manning the shortstop position the entire weekend, Green plays the position with bounce and athleticism, pairing it with sure-handedness that made a number of tough plays on the weekend.
INF Brady Green (Oak Park-River Forest, 2025), recently stood out at the Lockport Preseason ID in all aspects of the game and showed much more of the same at the loaded All-State event. Green looked like one of the top uncommitted 2025s at the event thanks to much-improved bat speed and offensive overall profile. Green has a chance to be a middle of the order type of bat who has feel to hit to go along with emerging power potential. Green showed even more bat speed than at Lockport, averaging 67.1 mph bat speed while staying on-plane (82% efficiency) and using the whole field. The 5-foot-10, 170-pound shortstop also took one of the top rounds of infield defense with easy range, smooth hands and a strong arm that topped at 86 mph. High-follow 2025 prospect.
INF Brady Green (Oak Park-River Forest, 2025), recently stood out at the Lockport Preseason ID in all aspects of the game and showed much more of the same at the loaded All-State event. Green looked like one of the top uncommitted 2025s at the event thanks to much-improved bat speed and offensive overall profile. Green has a chance to be a middle of the order type of bat who has feel to hit to go along with emerging power potential. Green showed even more bat speed than at Lockport, averaging 67.1 mph bat speed while staying on-plane (82% efficiency) and using the whole field. The 5-foot-10, 170-pound shortstop also took one of the top rounds of infield defense with easy range, smooth hands and a strong arm that topped at 86 mph. High-follow 2025 prospect.
Positional Profile: SS/RHP
Body: 5-10, 170-pounds. Athletic build with developing strength.
Hit: RHH. Balanced stance, big knee kick trigger. Advanced bat speed, short to the ball, long through it, flat, backspin contact to both gaps.
Power: 91 max exit velocity, averaged 83.2 mph. 282’ max distance.
Arm: RH. INF - 86 mph. Quick, athletic arm, high 3/4 release, plays on the move.
Defense: Athletic through the ball, quick/clean transfer, easy range with a quick first step, soft hands.
Run: 7.14 runner in the 60.
INF Brady Green (Oak Park River Forest, 2025) impressed last August at the Illinois State Games and continued to solidify himself at Lockport as one of the top uncommitted infielders in the state. Green has improved his strength over the winter and it was evident during BP where he was averaging exit velocities off the bat that were similar to what his max exit velocity was about five months ago. Green swings with controlled aggression, stays on-plane and looks to drive baseballs with authority to both gaps. On the infield, Green moves with athletic actions and fluid rhythm, utilizing soft hands to secure the ball out front before moving into a clean transfer. As a 7.02 runner in the 60, his speed easily translates to the infield, moving with a quick first step and ranging well laterally. His arm plays with easy life and backspin across the diamond, reaching up to 86 mph across the infield.
Positional Profile: SS/RHP
Body: 5-10, 170-pounds. Strong frame, athletic, projectable body.
Hit: RHH. Balanced, relaxed setup, fluid load and leg-kick trigger. Athletic, strong, quick bat, stays through the zone a long time, on the barrel with authority to both gaps.
Power: 99 max exit velocity, averaged 90.3 mph. 355’ max distance.
Arm: RH. INF - 86 mph. Easy life with backspin.
Defense: Soft/fluid hands, athletic actions with rhythm, well-above average actions and defender.
Run: 7.02 runner in the 60.
INF Brady Green (Oak Park-River Forest) emerged as a name-to-know in the Illinois’ 2025 class after an impressive showing, particularly defensively. Green made several strong plays on the infield, including a backhand in the six-hole that he finished with a strong, accurate throw across the diamond. His athleticism and actions suggest he’ll stick up the middle long term, where Green can be an asset with the glove. Offensively, he swings a loose right-handed bat with rotation and athleticism that flashed upside throughout the event.
Positional Profile: MIF
Body: 5-10, 160-pounds. Athletic frame with present strength.
Hits: RHH. Balanced setup, fluid load and stride. Controlled intent, athletic hands, bat stays through the zone.
Power: 89 max exit velocity, averaged 73 MPH. 268' max distance.
Arm: RH. INF-82 mph.Athletic arm action, plays quick and from multiple slots.
Defense: Light, active feet, attacks his hop, comfortable and smooth on the move, plays with above-average body control and fluid release.
Run: 7.31 runner in the 60.
Vizual Edge: 68.89 Edge Score
Positional Profile: SS/RHP
Body: 5-9, 160-pounds. Sloped shoulders.
Hit: RHH. Balanced setup, smooth load, leg kick timing trigger. Direct path, gets extension through contact, highly repeatable, used the whole field.
Power: 92.1 max exit velocity, averaged 78.4 mph. 277’ max distance.
Arm: RH. INF - 82 mph. Short arm action, 3/4 slot. Accurate throws on the move.
Defense: Loose actions. Quick hands and feet.
Run: 7.31 runner in the 60.
Green has a compact 5-foot-9, 160-pound frame, ran a 7.31 in the 60, and he stays short, direct and repeats at a high rate from the right side of the plate. Green gets extension through contact and he made hard contact to all fields during his round.
Positional Profile: SS
Body: 5-9, 160-pounds. Athletic, well-proportioned frame.
Hit: RHH. Crouched setup, short stride. Level path to the ball while maintaining balance throughout contact.
Power: 83.7 max exit velocity, averaged 77.6 mph. 292’ max distance.
Arm: RH. INF - 77 mph. Loose, high 3/4 slot, arm flashed carry.
Defense: Agile footwork, moves well side-to-side, clean transfer with soft hands.
Run: 7.67 runner in the 60.
Positional Profile: SS/RHP
Body: 5-8, 160-pounds.
Hit: RHH. Static setup, short lift and replace stride, hands drop into load. Path works with some length, slightly uphill, showed some bat strength.
Power: 84.85 max exit velocity, averaged 78.84 mph. 305’ max distance.
Arm: RH. INF - 77 mph. Short arm action, 3/4 slot.
Defense: Soft hands with a quick transfer, quick/athletic footwork, plays through the ball.
Run: 7.78 runner in the 60.
Position: SS/RHP
Body: 5-foot-9, 160-pound.
Hit: (RHH) Balanced, slightly crouched setup, minimal pre-pitch load and short stride. Simple swing, creates above-average bat speed and long path that stays through the hitting zone.
Power: 81 mph exit velocity.
Defense: (INF) Aggressive to the baseball, quick footwork, steady hands and clean release.
Arm: 74 mph infield velocity. Long arm action, high ¾ slot.
Speed: 7.93 (60-yard dash).