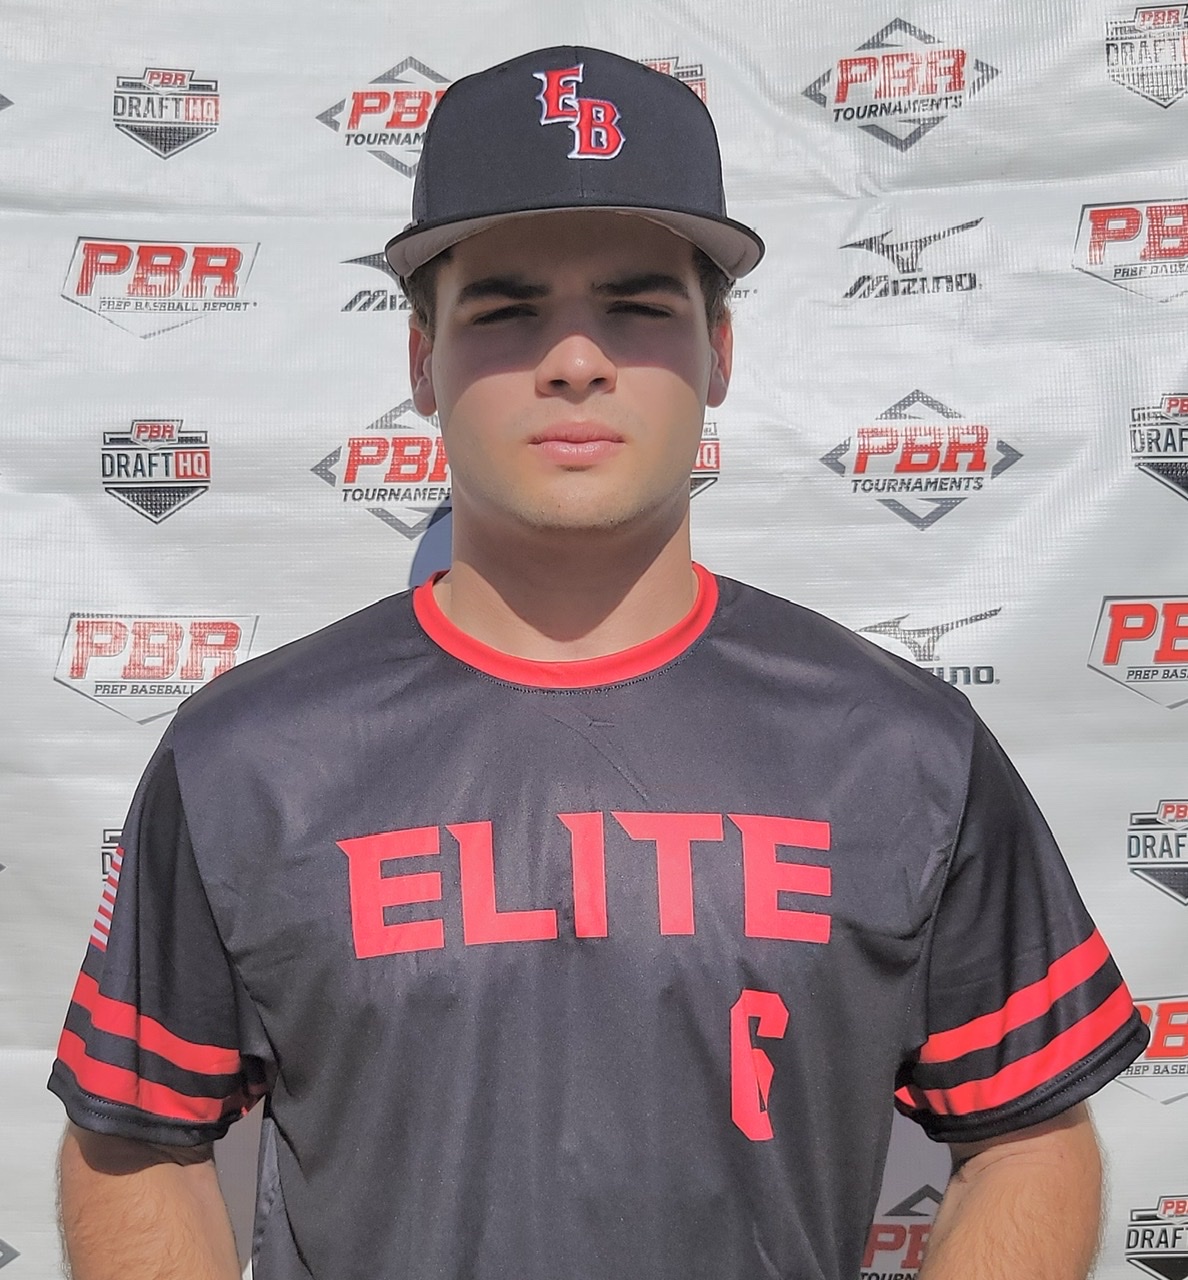
CLASS OF 2024
SS
OF
Trent
Cornell
San Francisco
Altoona (HS) • WI
5' 9" • 180LBS
R/R • 19yr 8mo
Travel Team: Elite National/Minnesota Blizzard
Altoona (HS) • WI
5' 9" • 180LBS
R/R • 19yr 8mo
Travel Team: Elite National/Minnesota Blizzard
Rankings
2024 National
Rankings available to Premium Subscriber
2024 State
Rankings available to Premium Subscriber
Commitment
Best Of Stats
21.9
Hand Speed (max)
7/27/22
78.9
Bat Speed (max)
6/04/22
23.2
Rot. Acc (max)
7/27/22
43
Hard Hit %
6/04/22
95.6
Exit Velocity (max)
6/04/22
86.3
Exit Velocity (avg)
7/27/22
335
Distance (max)
7/27/22
63
Sweet Spot %
7/27/22
6.92
60
9/05/21
-
30-yd
-
10-yd
17.6
Run speed (max)
6/04/22
82
INF Velo
6/04/22
-
OF Velo
-
C Velo
-
Pop Time
Positional Tools
2022
Infield Velocity
The athlete's maximum throwing velocity from an infield position in the given event year. Measured in miles per hour (MPH).
82.0
Hitting

2022
Exit Velocity Max
The highest exit velocity of any batted ball in the given event year. Measured in miles per hour (MPH).
95.6
Exit Velocity Avg
Average exit velocity of all batted balls in the given event year. Measured in miles per hour (MPH).
85.4
Distance Max
The highest flight distance of any batted ball in the given event year. Measured in feet (ft).
328
Distance Avg
Average flight distance of all batted balls in the given event year. Measured in feet (ft).
214
Launch Angle Avg
Average launch angle of all batted balls in the given event year. Measured in degrees.
25.6
Hard Hit %
Percentage of batted balls with exit velocities over 95 MPH in the given event year.
Sweet Spot %
Percentage of batted balls in the given event year with a launch angle between 8° and 32°.
Line Drive %
Percentage of batted balls with launch angles between 10 and 25 degrees in the given event year.
Fly Ball %
Percentage of batted balls with launch angles between 25 and 50 degrees in the given event year.
Ground Ball %
Percentage of batted balls with launch angles below 10 degrees in the given event year.
2022 PBR Future Games
Jul 27, 2022
Trackman - Hitting
94.2
Exit Velocity (max)
86.3
Exit Velocity (avg)
270
Distance (avg)
335
Distance (max)
Hard Hit %
Sweet Spot %
Line Drive %
Fly Ball %
2022 Elite Baseball Scout Day (Summer)
Jun 4, 2022
Trackman - Hitting
95.6
Exit Velocity (max)
85.4
Exit Velocity (avg)
214
Distance (avg)
328
Distance (max)
Hard Hit %
Sweet Spot %
Line Drive %
Fly Ball %
Ground Ball %
Hitting

2022
Hand Speed Max
The highest Peak Hand Speed of any swing in the given event year.
21.9
Hand Speed Avg
The average Peak Hand Speed for all swings in the given event year.
20.9
Bat Speed Max
The highest Bat Speed of any swing in the given event year.
78.9
Bat Speed Avg
The average Bat Speed for all swings in the given event year.
76.1
Rotational Acceleration Max
The highest Rotational Acceleration of any swing in the given event year.
Rotational Acceleration Avg
The average Rotational Acceleration for all swings in the given event year.
On-Plane Efficiency Max
The highest On-Plane Efficiency of any swing in the given event year.
On-Plane Efficiency Avg
The average On-Plane Efficiency for all swings in the given event year.
2022 PBR Future Games
Jul 27, 2022
Blast - Hitting
21.9
Hand Speed (max)
21.2
Hand Speed (avg)
77.2
Bat Speed (max)
75.4
Bat Speed (avg)
Rot. Acc (max)
Rot. Acc (avg)
On Plane Eff (avg)
MaxOnPlaneEfficiency
2022 Elite Baseball Scout Day (Summer)
Jun 4, 2022
Blast - Hitting
21.3
Hand Speed (max)
20.7
Hand Speed (avg)
78.9
Bat Speed (max)
76.7
Bat Speed (avg)
Rot. Acc (max)
Rot. Acc (avg)
On Plane Eff (avg)
MaxOnPlaneEfficiency
Pitching

Pitch Scores
Pitching Velos
Game Performance

2022
60 Yard Dash
The athlete's fastest 0-60-yard time in the given event year. Measured in seconds.
6.97
Top Speed (MPH)
The athlete's fastest split time converted to miles per hour.
2022 PBR Future Games
Jul 27, 2022
Swift
1.79
10-yd
4.01
30-yd
7.18
60-yd
19.3
Run speed (max)
8.4
Run Speed (avg)
2.06
RSi (max)
2.06
RSi (avg)
1,494
Jump Power (max)
25.6
Jump Height (max)
25.3
Jump Height (avg)
Visual Edge

2022
Edge Score
The highest Edge Score within the given year. Edge Score is a comprehensive score that takes the core-six visual skills into account, providing an assessment of an athlete’s overall visual ability.
84.07
Pitch Ai

Notes
News
- Final Wisconsin Power 25 Update - Jun 19, 2023
- Top 10 Stories of 2022: Team Wisconsin Garners Attention at Future Games - Dec 28, 2022
- Wisconsin Class of 2024 Rankings: Update - Aug 24, 2022
- PBR Future Games: Team Wisconsin, Game Recaps - Jul 29, 2022
- Best of 2021: 60-Yard Dash Leaders - Jan 6, 2022
- Wisconsin Class of 2024 Rankings: Nos. 16-25 - Oct 28, 2021
Comments
Draft Reports
Contact
Premium Content Area
To unlock contact information, you need to purchase a ScoutPLUS subscription.
Purchase Subscription OR
Login


 Sign in to view rankings
Cornell is a compact framed 5-foot-9, 180-pound twitchy athlete with tools and skill. He impressed in batting practice with a powerful swing using the ground incredibly well which drives the impressive bat speed through the ball. Trent was launching balls to both gaps which reached 94 mph exit velocity off the bat. In the infield he showed baseball actions to play all three infield spots and also projects to play in the outfield grass. An ultra intense competitor, Trent is one of the top uncommitted talents in the state and it would be surprising if he remained much longer.