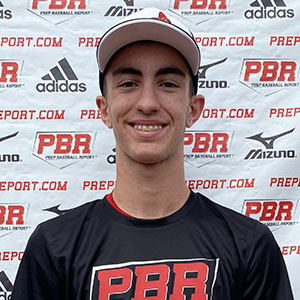
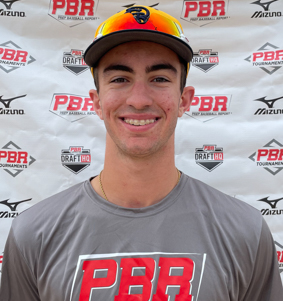
CLASS OF 2023
1B
3B
Crete
Slattery
Ripon College
Lake Geneva Badger (HS) • WI
6' 4" • 195LBS
• 19yr 10mo
Travel Team: Brew State Baseball Academy
Lake Geneva Badger (HS) • WI
6' 4" • 195LBS
• 19yr 10mo
Travel Team: Brew State Baseball Academy
Rankings
2023 National
Rankings available to Premium Subscriber
2023 State
Rankings available to Premium Subscriber
Commitment
Best Of Stats
27.2
Hand Speed (max)
7/12/22
76.2
Bat Speed (max)
3/19/22
23.7
Rot. Acc (max)
3/19/22
40
Hard Hit %
7/12/22
96.2
Exit Velocity (max)
7/12/22
85.4
Exit Velocity (avg)
3/21/21
353
Distance (max)
3/19/22
80
Sweet Spot %
3/21/21
7.59
60
6/23/21
4.24
30-yd
7/12/22
1.84
10-yd
7/12/22
17.7
Run speed (max)
7/12/22
78
INF Velo
7/12/22
-
OF Velo
-
C Velo
-
Pop Time
Fastball
72
Velocity (max)
6/24/20
69 - 71
Velo Range
6/24/20
1539
Spin Rate (avg)
6/24/20
Changeup
57 - 62
Velo Range
6/24/20
1377
Spin Rate (avg)
6/24/20
Curveball
53 - 57
Velo Range
6/24/20
1752
Spin Rate (avg)
6/24/20
Positional Tools
2022
2021
2020
60 Yard Dash
The athlete's fastest 60-yard dash time in the given event year. Measured in seconds (s)
7.66
Infield Velocity
The athlete's maximum throwing velocity from an infield position in the given event year. Measured in miles per hour (MPH).
78.0
Power / Speed Score
A simple calculation that divides the athlete’s Exit Velocity Max by the athlete’s 60 Yard Dash time for the given event year. For example, 98 MPH / 7.00s = 14.00.
12.6
60 Yard Dash
The athlete's fastest 60-yard dash time in the given event year. Measured in seconds (s)
7.59
Infield Velocity
The athlete's maximum throwing velocity from an infield position in the given event year. Measured in miles per hour (MPH).
78.0
Power / Speed Score
A simple calculation that divides the athlete’s Exit Velocity Max by the athlete’s 60 Yard Dash time for the given event year. For example, 98 MPH / 7.00s = 14.00.
12.2
60 Yard Dash
The athlete's fastest 60-yard dash time in the given event year. Measured in seconds (s)
7.88
Infield Velocity
The athlete's maximum throwing velocity from an infield position in the given event year. Measured in miles per hour (MPH).
68.0
Power / Speed Score
A simple calculation that divides the athlete’s Exit Velocity Max by the athlete’s 60 Yard Dash time for the given event year. For example, 98 MPH / 7.00s = 14.00.
10.8
Hitting

2022
2021
2020
Exit Velocity Max
The highest exit velocity of any batted ball in the given event year. Measured in miles per hour (MPH).
96.2
Exit Velocity Avg
Average exit velocity of all batted balls in the given event year. Measured in miles per hour (MPH).
85.2
Distance Max
The highest flight distance of any batted ball in the given event year. Measured in feet (ft).
353
Distance Avg
Average flight distance of all batted balls in the given event year. Measured in feet (ft).
195
Launch Angle Avg
Average launch angle of all batted balls in the given event year. Measured in degrees.
19.2
Hard Hit %
Percentage of batted balls with exit velocities over 95 MPH in the given event year.
Sweet Spot %
Percentage of batted balls in the given event year with a launch angle between 8° and 32°.
Line Drive %
Percentage of batted balls with launch angles between 10 and 25 degrees in the given event year.
Fly Ball %
Percentage of batted balls with launch angles between 25 and 50 degrees in the given event year.
Ground Ball %
Percentage of batted balls with launch angles below 10 degrees in the given event year.
Exit Velocity Max
The highest exit velocity of any batted ball in the given event year. Measured in miles per hour (MPH).
92.8
Exit Velocity Avg
Average exit velocity of all batted balls in the given event year. Measured in miles per hour (MPH).
83.2
Distance Max
The highest flight distance of any batted ball in the given event year. Measured in feet (ft).
332
Distance Avg
Average flight distance of all batted balls in the given event year. Measured in feet (ft).
226
Launch Angle Avg
Average launch angle of all batted balls in the given event year. Measured in degrees.
25.6
Hard Hit %
Percentage of batted balls with exit velocities over 95 MPH in the given event year.
Sweet Spot %
Percentage of batted balls in the given event year with a launch angle between 8° and 32°.
Line Drive %
Percentage of batted balls with launch angles between 10 and 25 degrees in the given event year.
Fly Ball %
Percentage of batted balls with launch angles between 25 and 50 degrees in the given event year.
Ground Ball %
Percentage of batted balls with launch angles below 10 degrees in the given event year.
Exit Velocity Max
The highest exit velocity of any batted ball in the given event year. Measured in miles per hour (MPH).
85.1
Exit Velocity Avg
Average exit velocity of all batted balls in the given event year. Measured in miles per hour (MPH).
77.8
Distance Max
The highest flight distance of any batted ball in the given event year. Measured in feet (ft).
312
Distance Avg
Average flight distance of all batted balls in the given event year. Measured in feet (ft).
259
Launch Angle Avg
Average launch angle of all batted balls in the given event year. Measured in degrees.
36.2
Hard Hit %
Percentage of batted balls with exit velocities over 95 MPH in the given event year.
Sweet Spot %
Percentage of batted balls in the given event year with a launch angle between 8° and 32°.
Line Drive %
Percentage of batted balls with launch angles between 10 and 25 degrees in the given event year.
Fly Ball %
Percentage of batted balls with launch angles between 25 and 50 degrees in the given event year.
Ground Ball %
Percentage of batted balls with launch angles below 10 degrees in the given event year.
Top Prospect Games: Upperclass (Invite-Only)
Jul 12, 2022
Trackman - Hitting
96.2
Exit Velocity (max)
85.1
Exit Velocity (avg)
182
Distance (avg)
319
Distance (max)
Hard Hit %
Sweet Spot %
Line Drive %
Fly Ball %
Ground Ball %
Milwaukee Preseason ID
Mar 19, 2022
Trackman - Hitting
93.3
Exit Velocity (max)
85.3
Exit Velocity (avg)
208
Distance (avg)
353
Distance (max)
Hard Hit %
Sweet Spot %
Line Drive %
Fly Ball %
Ground Ball %
Underclass Trials
Jun 23, 2021
Trackman - Hitting
91.5
Exit Velocity (max)
81.0
Exit Velocity (avg)
200
Distance (avg)
320
Distance (max)
Hard Hit %
Sweet Spot %
Fly Ball %
Ground Ball %
Milwaukee Preseason I.D.
Mar 21, 2021
Trackman - Hitting
92.8
Exit Velocity (max)
85.4
Exit Velocity (avg)
251
Distance (avg)
332
Distance (max)
Hard Hit %
Sweet Spot %
Line Drive %
Fly Ball %
Ground Ball %
Underclass Trials
Jun 24, 2020
Trackman - Hitting
85.1
Exit Velocity (max)
77.8
Exit Velocity (avg)
259
Distance (avg)
312
Distance (max)
Sweet Spot %
Line Drive %
Fly Ball %
Hitting

2022
2021
Hand Speed Max
The highest Peak Hand Speed of any swing in the given event year.
27.2
Hand Speed Avg
The average Peak Hand Speed for all swings in the given event year.
26.1
Bat Speed Max
The highest Bat Speed of any swing in the given event year.
76.2
Bat Speed Avg
The average Bat Speed for all swings in the given event year.
72.1
Rotational Acceleration Max
The highest Rotational Acceleration of any swing in the given event year.
Rotational Acceleration Avg
The average Rotational Acceleration for all swings in the given event year.
On-Plane Efficiency Max
The highest On-Plane Efficiency of any swing in the given event year.
On-Plane Efficiency Avg
The average On-Plane Efficiency for all swings in the given event year.
Hand Speed Max
The highest Peak Hand Speed of any swing in the given event year.
24.1
Hand Speed Avg
The average Peak Hand Speed for all swings in the given event year.
22.8
Bat Speed Max
The highest Bat Speed of any swing in the given event year.
70.6
Bat Speed Avg
The average Bat Speed for all swings in the given event year.
68.2
Rotational Acceleration Max
The highest Rotational Acceleration of any swing in the given event year.
Rotational Acceleration Avg
The average Rotational Acceleration for all swings in the given event year.
On-Plane Efficiency Max
The highest On-Plane Efficiency of any swing in the given event year.
On-Plane Efficiency Avg
The average On-Plane Efficiency for all swings in the given event year.
Top Prospect Games: Upperclass (Invite-Only)
Jul 12, 2022
Blast - Hitting
27.2
Hand Speed (max)
26.1
Hand Speed (avg)
75.6
Bat Speed (max)
71.8
Bat Speed (avg)
Rot. Acc (max)
Rot. Acc (avg)
On Plane Eff (avg)
MaxOnPlaneEfficiency
Milwaukee Preseason ID
Mar 19, 2022
Blast - Hitting
26.9
Hand Speed (max)
26.0
Hand Speed (avg)
76.2
Bat Speed (max)
72.3
Bat Speed (avg)
Rot. Acc (max)
Rot. Acc (avg)
On Plane Eff (avg)
MaxOnPlaneEfficiency
Milwaukee Preseason I.D.
Mar 21, 2021
Blast - Hitting
24.1
Hand Speed (max)
22.8
Hand Speed (avg)
70.6
Bat Speed (max)
68.2
Bat Speed (avg)
Rot. Acc (max)
Rot. Acc (avg)
On Plane Eff (avg)
MaxOnPlaneEfficiency
Underclass Trials
Jun 24, 2020
Blast - Hitting
23.9
Hand Speed (max)
22.7
Hand Speed (avg)
67.4
Bat Speed (max)
64.6
Bat Speed (avg)
Rot. Acc (max)
Rot. Acc (avg)
On Plane Eff (avg)
Pitching

2020
Fastball
Velocity Max
The maximum observed fastball velocity in the given event year. Measured in miles per hour (MPH).
70.7
Fastball
Velocity Avg
The average velocity for all pitches of this type in the given event year. Measured in miles per hour (MPH).
69.5
Fastball
Spin Rate Avg
The average rate of spin for all pitches of this type in the given event year. Measured in rotations per minute (RPM).
1539
Fastball
Spin Score Avg
The average Bauer Units value of all fastballs in the given event year. Bauer Units are calculated for each pitch by dividing Spin Rate by Velocity.
22.2
Fastball
Total Movement Avg
The average total non-gravity movement for all pitches of this type in the given event year. Measured in inches (in).
Curveball
Velocity Avg
The average velocity for all pitches of this type in the given event year. Measured in miles per hour (MPH).
55.1
Curveball
Spin Rate Avg
The average rate of spin for all pitches of this type in the given event year. Measured in rotations per minute (RPM).
1752
Curveball
Total Movement Avg
The average total non-gravity movement for all pitches of this type in the given event year. Measured in inches (in).
Changeup
Velocity Avg
The average velocity for all pitches of this type in the given event year. Measured in miles per hour (MPH).
59.4
Changeup
Spin Rate Avg
The average rate of spin for all pitches of this type in the given event year. Measured in rotations per minute (RPM).
1377
Changeup
Total Movement Avg
The average total non-gravity movement for all pitches of this type in the given event year. Measured in inches (in).
Underclass Trials
Jun 24, 2020
Trackman - Fastball
70.7
Velocity (max)
68.2 - 70.7
Velo Range
66.5
Eff Velocity (avg)
1,753
Spin Rate (max)
1,539
Spin Rate (avg)
IVB (max)
IVB (avg)
HM (max)
HM (avg)
Extension (avg)
Release Ht (avg)
Spin Score (max)
Zone %
Trackman - Curveball
56.9
Velocity (max)
53.5 - 56.8
Velo Range
51.7
Eff Velocity (avg)
1,815
Spin Rate (max)
1,752
Spin Rate (avg)
IVB (max)
IVB (avg)
HM (max)
HM (avg)
Extension (avg)
Release Ht (avg)
Spin Score (max)
Trackman - ChangeUp
62.2
Velocity (max)
57.3 - 61.5
Velo Range
57.3
Eff Velocity (avg)
1,458
Spin Rate (max)
1,377
Spin Rate (avg)
IVB (max)
IVB (avg)
HM (max)
HM (avg)
Extension (avg)
Release Ht (avg)
Spin Score (max)
Zone %
Pitch Scores
Pitching Velos
2020
Fastball
Velocity Max
The maximum observed fastball velocity in the given event year. Measured in miles per hour (MPH).
72.0
Fastball
Velocity Avg
The average velocity for all pitches of this type in the given event year. Measured in miles per hour (MPH)
70.0
Curveball
Velocity Avg
The average velocity for all pitches of this type in the given event year. Measured in miles per hour (MPH)
55.0
Changeup
Velocity Avg
The average velocity for all pitches of this type in the given event year. Measured in miles per hour (MPH)
59.5
Game Performance

2022
10 Yard Dash
The athlete's fastest 0-10-yard split time in the given event year. Measured in seconds.
1.84
30 Yard Dash
The athlete's fastest 0-30-yard split time in the given event year. Measured in seconds.
4.24
60 Yard Dash
The athlete's fastest 0-60-yard time in the given event year. Measured in seconds.
7.71
Top Speed (MPH)
The athlete's fastest split time converted to miles per hour.
RSi
The reactive strength index measurement of an athlete's explosiveness by comparing their jump height to the ground contact time in between their jumps. On a scale of 0-5.
Vertical Jump
A measure of any athlete's body strength and reach calculated from the flight time divided by the contact time.
Top Prospect Games: Upperclass (Invite-Only)
Jul 12, 2022
Swift
1.84
10-yd
4.24
30-yd
7.71
60-yd
17.7
Run speed (max)
7.8
Run Speed (avg)
1.69
RSi (max)
1.69
RSi (avg)
1,598
Jump Power (max)
24.6
Jump Height (max)
24.4
Jump Height (avg)
Visual Edge

2022
Edge Score
The highest Edge Score within the given year. Edge Score is a comprehensive score that takes the core-six visual skills into account, providing an assessment of an athlete’s overall visual ability.
72.38
Pitch Ai

Notes
News
- Weeks 1 & 2 Diamond Notes - Apr 14, 2023
- Top Prospect Games: Data Dive - Jul 21, 2022
- Midwest Premier Super 17 (Member): Preview Story - Jun 22, 2022
- Milwaukee Preseason ID: Blast Motion Board - Mar 31, 2022
- Milwaukee Preseason ID: TrackMan Files - Mar 30, 2022
- Wisconsin Underclass Trials: Pitcher Analysis - Sep 8, 2020
- Wisconsin Underclass Trials: Infielder Analysis - Sep 3, 2020
Comments
Draft Reports
Contact
Premium Content Area
To unlock contact information, you need to purchase a ScoutPLUS subscription.
Purchase Subscription OR
Login


 Sign in to view rankings
Positional Profile: 3B
Body: 6-3, 195-pounds. Longer frame, wiry, strong throughout
Hits: . Wide base, short trigger Longer path makes up for it with quick hands, shows ability to spray to all fields
Power: 96 max exit velocity, averaged 85.1 MPH. 319' max distance.
Arm: . INF-78 mph .3Q slot, carry accurate, strong arm
Defense: feel around bag
Run: 7.71 runner in the 60.
Slattery boasts one of the weekend’s most projectable frames, standing at a lanky 6-foot-3, 185-pounds. He used those long levers to whip several baseballs around the yard, finishing the PBR at The Rock Fall Championships with an 8-for-10 performance for Brew State Baseball Academy’s upper class team.
Positional Profile: 1B/3B
Body: 6-3, 185-pounds. Lanky, long-levered frame with room for added physical projection.
Hit: RH. Balanced setup, athletic look, slightly open base, toe-tap trigger into a short stride, smooth finish. More rotational since last look elevated attack angle and pull-side approach. Barrel stays in the zone, repeats.
Power: 91.5 mph max exit velocity, 81.0 mph average. 320' max distance. Power ceiling once strength is added to frame.
Arm: RH. INF - 78 mph. Short arm action, high 3/4 slot.
Defense: Two-hand gather out front of body, steady double play feeds, some footwork feel around the bag, plays through the baseball.
Run: 7.59 runner in the 60.
Positional Profile: 1B/3B
Body: 6-3, 185-pounds. Lanky levers, high waist.
Hit: RH. Balanced setup, open base, bat starts rested on back shoulder, quick toe-tap trigger into a short stride, controlled finish. Some barrel length through the zone, elevates out front, gap-to-gap approach and repeats.
Power: 92.8 mph max exit velocity, 84.5 mph average. 332' max distance.
Arm: RH. INF - 74 mph. Shorter arm draw with some wrap on the backside, high 3/4 release.
Defense: Attacks the baseball, glove plays out front, low two-hand gather, corner infield profile.
Run: 7.82 runner in the 60.
Positional Profile: 3B/RHP
Body: 6-3, 173-pounds. Lanky levers, high waist.
Delivery: Squared start, big side step, hands go over head, high knee balance point. Drives with level shoulders, toe-open landing, athletic finish.
Arm Action: . Long arm circle to high 3/4 slot.
FB: T72, 69-71 mph. Some arm-side run/sink.
CB: 53-57 mph. 11/5 shape with gradual action.
CH: 57-62 mph. Arm-side run/fade.
Hit: RH. Quiet in the box, balanced setup, bat rests on back shoulder, hands load back, short stride to even. Simple swing, level bat path, line drive type approach.
Power: 85 mph exit velocity from the tee.
Arm: RH. INF - 68 mph. Short arm action, 3/4 slot.
Defense: Active feet come to the baseball, two-hand gather, plays through at times.
Run: 7.88 runner in the 60.