CLASS OF 2023
1B
OF
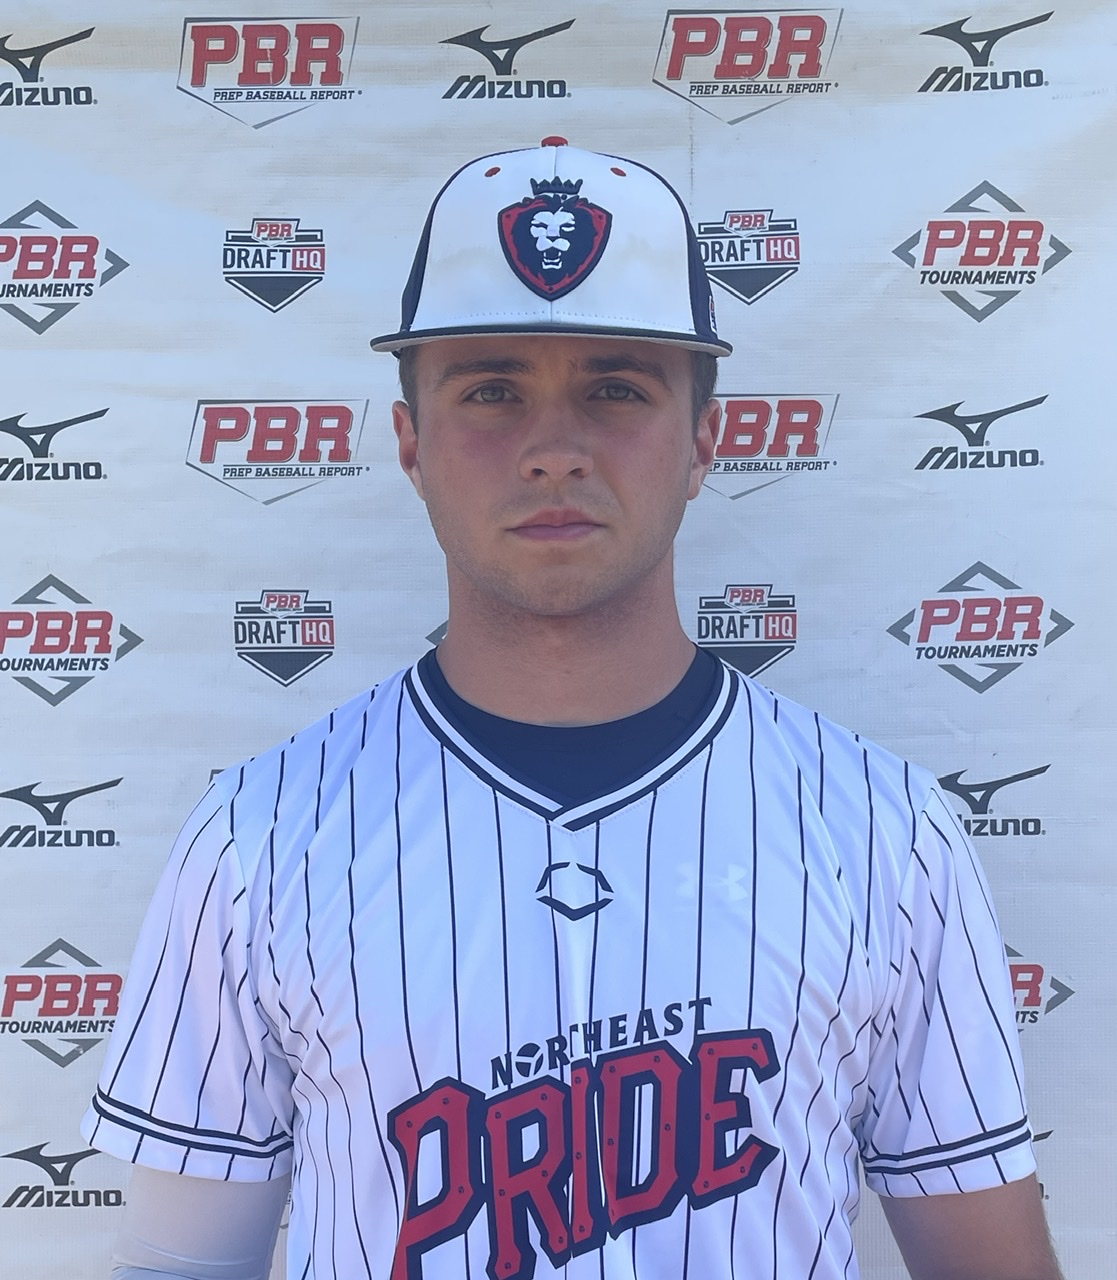
Trevor
Balcerzak
SUNY-Cortland
Riverside (HS) • PA
6' 2" • 190LBS
R/R • 19yr 5mo
Travel Team: Northeast Pride 23 Scout
Riverside (HS) • PA
6' 2" • 190LBS
R/R • 19yr 5mo
Travel Team: Northeast Pride 23 Scout
Rankings
2023 National
Rankings available to Premium Subscriber
2023 State
Rankings available to Premium Subscriber
Commitment
Best Of Stats
25
Hand Speed (max)
6/14/22
76.7
Bat Speed (max)
6/14/22
20.7
Rot. Acc (max)
2/15/21
70
Hard Hit %
8/09/22
95
Exit Velocity (max)
8/09/22
88.6
Exit Velocity (avg)
6/14/22
339
Distance (max)
8/09/22
80
Sweet Spot %
6/14/22
6.98
60
6/14/22
4.05
30-yd
8/09/22
1.79
10-yd
8/09/22
19.5
Run speed (max)
8/09/22
83
INF Velo
6/14/22
85
OF Velo
6/08/22
-
C Velo
-
Pop Time
Fastball
78
Velocity (max)
3/06/22
75.5 - 77.4
Velo Range
3/06/22
2026
Spin Rate (avg)
3/06/22
Changeup
65 - 68
Velo Range
2/15/21
1562
Spin Rate (avg)
2/15/21
Curveball
62.5 - 65
Velo Range
3/06/22
1999
Spin Rate (avg)
3/06/22
Positional Tools
2022
2021
2020
60 Yard Dash
The athlete's fastest 60-yard dash time in the given event year. Measured in seconds (s)
6.98
Infield Velocity
The athlete's maximum throwing velocity from an infield position in the given event year. Measured in miles per hour (MPH).
83.0
Outfield Velocity
The athlete's maximum throwing velocity from an outfield position in the given event year. Measured in miles per hour (MPH).
85.0
Power / Speed Score
A simple calculation that divides the athlete’s Exit Velocity Max by the athlete’s 60 Yard Dash time for the given event year. For example, 98 MPH / 7.00s = 14.00.
13.6
60 Yard Dash
The athlete's fastest 60-yard dash time in the given event year. Measured in seconds (s)
7.28
Infield Velocity
The athlete's maximum throwing velocity from an infield position in the given event year. Measured in miles per hour (MPH).
73.0
Power / Speed Score
A simple calculation that divides the athlete’s Exit Velocity Max by the athlete’s 60 Yard Dash time for the given event year. For example, 98 MPH / 7.00s = 14.00.
11.8
60 Yard Dash
The athlete's fastest 60-yard dash time in the given event year. Measured in seconds (s)
7.87
Home to First
The athlete's fastest home-to-first time in the given event year. Measured from bat-on-ball to foot-on-bag, in seconds (s).
4.88
Infield Velocity
The athlete's maximum throwing velocity from an infield position in the given event year. Measured in miles per hour (MPH).
67.0
Power / Speed Score
A simple calculation that divides the athlete’s Exit Velocity Max by the athlete’s 60 Yard Dash time for the given event year. For example, 98 MPH / 7.00s = 14.00.
9.0
Hitting

2022
2021
Exit Velocity Max
The highest exit velocity of any batted ball in the given event year. Measured in miles per hour (MPH).
95.0
Exit Velocity Avg
Average exit velocity of all batted balls in the given event year. Measured in miles per hour (MPH).
86.7
Distance Max
The highest flight distance of any batted ball in the given event year. Measured in feet (ft).
339
Distance Avg
Average flight distance of all batted balls in the given event year. Measured in feet (ft).
213
Launch Angle Avg
Average launch angle of all batted balls in the given event year. Measured in degrees.
17.9
Hard Hit %
Percentage of batted balls with exit velocities over 95 MPH in the given event year.
Sweet Spot %
Percentage of batted balls in the given event year with a launch angle between 8° and 32°.
Line Drive %
Percentage of batted balls with launch angles between 10 and 25 degrees in the given event year.
Fly Ball %
Percentage of batted balls with launch angles between 25 and 50 degrees in the given event year.
Ground Ball %
Percentage of batted balls with launch angles below 10 degrees in the given event year.
Exit Velocity Max
The highest exit velocity of any batted ball in the given event year. Measured in miles per hour (MPH).
85.5
Exit Velocity Avg
Average exit velocity of all batted balls in the given event year. Measured in miles per hour (MPH).
74.6
Distance Max
The highest flight distance of any batted ball in the given event year. Measured in feet (ft).
234
Distance Avg
Average flight distance of all batted balls in the given event year. Measured in feet (ft).
107
Launch Angle Avg
Average launch angle of all batted balls in the given event year. Measured in degrees.
8.7
Hard Hit %
Percentage of batted balls with exit velocities over 95 MPH in the given event year.
Sweet Spot %
Percentage of batted balls in the given event year with a launch angle between 8° and 32°.
Line Drive %
Percentage of batted balls with launch angles between 10 and 25 degrees in the given event year.
Fly Ball %
Percentage of batted balls with launch angles between 25 and 50 degrees in the given event year.
Ground Ball %
Percentage of batted balls with launch angles below 10 degrees in the given event year.
2022 PA Interstate Games
Oct 1, 2022
Trackman - Hitting
93.0
Exit Velocity (max)
86.8
Exit Velocity (avg)
179
Distance (avg)
299
Distance (max)
Hard Hit %
Sweet Spot %
Line Drive %
Fly Ball %
Ground Ball %
2022 Northeast Senior Games
Aug 9, 2022
Trackman - Hitting
95.0
Exit Velocity (max)
87.9
Exit Velocity (avg)
268
Distance (avg)
339
Distance (max)
Hard Hit %
Sweet Spot %
Line Drive %
Fly Ball %
Ground Ball %
2022 PA State Games (Session 2)
Jun 14, 2022
Trackman - Hitting
93.3
Exit Velocity (max)
88.6
Exit Velocity (avg)
209
Distance (avg)
307
Distance (max)
Hard Hit %
Sweet Spot %
Line Drive %
Ground Ball %
2022 Northeast Pride Scout Day (Summer)
Jun 8, 2022
Trackman - Hitting
94.5
Exit Velocity (max)
82.3
Exit Velocity (avg)
246
Distance (avg)
309
Distance (max)
Hard Hit %
Sweet Spot %
Line Drive %
Fly Ball %
2022 Northeast Pride Scout Day (Preseason)
Mar 6, 2022
Trackman - Hitting
93.1
Exit Velocity (max)
87.4
Exit Velocity (avg)
176
Distance (avg)
336
Distance (max)
Hard Hit %
Sweet Spot %
Line Drive %
Fly Ball %
Ground Ball %
2021 Baseball U - PA Scout Day (Preseason)
Feb 15, 2021
Trackman - Hitting
85.5
Exit Velocity (max)
74.6
Exit Velocity (avg)
107
Distance (avg)
234
Distance (max)
Sweet Spot %
Line Drive %
Fly Ball %
Ground Ball %
Hitting

2022
2021
Hand Speed Max
The highest Peak Hand Speed of any swing in the given event year.
25.0
Hand Speed Avg
The average Peak Hand Speed for all swings in the given event year.
21.8
Bat Speed Max
The highest Bat Speed of any swing in the given event year.
76.7
Bat Speed Avg
The average Bat Speed for all swings in the given event year.
72.0
Rotational Acceleration Max
The highest Rotational Acceleration of any swing in the given event year.
Rotational Acceleration Avg
The average Rotational Acceleration for all swings in the given event year.
On-Plane Efficiency Max
The highest On-Plane Efficiency of any swing in the given event year.
On-Plane Efficiency Avg
The average On-Plane Efficiency for all swings in the given event year.
Hand Speed Max
The highest Peak Hand Speed of any swing in the given event year.
23.5
Hand Speed Avg
The average Peak Hand Speed for all swings in the given event year.
21.0
Bat Speed Max
The highest Bat Speed of any swing in the given event year.
69.2
Bat Speed Avg
The average Bat Speed for all swings in the given event year.
65.5
Rotational Acceleration Max
The highest Rotational Acceleration of any swing in the given event year.
Rotational Acceleration Avg
The average Rotational Acceleration for all swings in the given event year.
On-Plane Efficiency Max
The highest On-Plane Efficiency of any swing in the given event year.
On-Plane Efficiency Avg
The average On-Plane Efficiency for all swings in the given event year.
2022 PA Interstate Games
Oct 1, 2022
Blast - Hitting
22.6
Hand Speed (max)
21.4
Hand Speed (avg)
74.7
Bat Speed (max)
70.4
Bat Speed (avg)
Rot. Acc (max)
Rot. Acc (avg)
On Plane Eff (avg)
MaxOnPlaneEfficiency
2022 Northeast Senior Games
Aug 9, 2022
Blast - Hitting
22.8
Hand Speed (max)
21.0
Hand Speed (avg)
75.1
Bat Speed (max)
72.9
Bat Speed (avg)
Rot. Acc (max)
Rot. Acc (avg)
On Plane Eff (avg)
MaxOnPlaneEfficiency
2022 PA State Games (Session 2)
Jun 14, 2022
Blast - Hitting
25.0
Hand Speed (max)
23.4
Hand Speed (avg)
76.7
Bat Speed (max)
74.2
Bat Speed (avg)
Rot. Acc (max)
Rot. Acc (avg)
On Plane Eff (avg)
MaxOnPlaneEfficiency
2021 Baseball U - PA Scout Day (Preseason)
Feb 15, 2021
Blast - Hitting
23.5
Hand Speed (max)
21.0
Hand Speed (avg)
69.2
Bat Speed (max)
65.5
Bat Speed (avg)
Rot. Acc (max)
Rot. Acc (avg)
On Plane Eff (avg)
MaxOnPlaneEfficiency
Pitching

2022
2021
Fastball
Velocity Max
The maximum observed fastball velocity in the given event year. Measured in miles per hour (MPH).
78.0
Fastball
Velocity Avg
The average velocity for all pitches of this type in the given event year. Measured in miles per hour (MPH).
76.4
Fastball
Spin Rate Avg
The average rate of spin for all pitches of this type in the given event year. Measured in rotations per minute (RPM).
2026
Fastball
Spin Score Avg
The average Bauer Units value of all fastballs in the given event year. Bauer Units are calculated for each pitch by dividing Spin Rate by Velocity.
26.5
Fastball
Total Movement Avg
The average total non-gravity movement for all pitches of this type in the given event year. Measured in inches (in).
Curveball
Velocity Avg
The average velocity for all pitches of this type in the given event year. Measured in miles per hour (MPH).
63.7
Curveball
Spin Rate Avg
The average rate of spin for all pitches of this type in the given event year. Measured in rotations per minute (RPM).
1999
Curveball
Total Movement Avg
The average total non-gravity movement for all pitches of this type in the given event year. Measured in inches (in).
Changeup
Velocity Avg
The average velocity for all pitches of this type in the given event year. Measured in miles per hour (MPH).
67.5
Changeup
Spin Rate Avg
The average rate of spin for all pitches of this type in the given event year. Measured in rotations per minute (RPM).
1538
Changeup
Total Movement Avg
The average total non-gravity movement for all pitches of this type in the given event year. Measured in inches (in).
Fastball
Velocity Max
The maximum observed fastball velocity in the given event year. Measured in miles per hour (MPH).
76.1
Fastball
Velocity Avg
The average velocity for all pitches of this type in the given event year. Measured in miles per hour (MPH).
74.7
Fastball
Spin Rate Avg
The average rate of spin for all pitches of this type in the given event year. Measured in rotations per minute (RPM).
1720
Fastball
Spin Score Avg
The average Bauer Units value of all fastballs in the given event year. Bauer Units are calculated for each pitch by dividing Spin Rate by Velocity.
23.0
Fastball
Total Movement Avg
The average total non-gravity movement for all pitches of this type in the given event year. Measured in inches (in).
Curveball
Velocity Avg
The average velocity for all pitches of this type in the given event year. Measured in miles per hour (MPH).
60.9
Curveball
Spin Rate Avg
The average rate of spin for all pitches of this type in the given event year. Measured in rotations per minute (RPM).
1782
Curveball
Total Movement Avg
The average total non-gravity movement for all pitches of this type in the given event year. Measured in inches (in).
Changeup
Velocity Avg
The average velocity for all pitches of this type in the given event year. Measured in miles per hour (MPH).
66.0
Changeup
Spin Rate Avg
The average rate of spin for all pitches of this type in the given event year. Measured in rotations per minute (RPM).
1562
Changeup
Total Movement Avg
The average total non-gravity movement for all pitches of this type in the given event year. Measured in inches (in).
2022 Northeast Pride Scout Day (Preseason)
Mar 6, 2022
Trackman - Fastball
78.0
Velocity (max)
75.5 - 77.4
Velo Range
74.9
Eff Velocity (avg)
2,125
Spin Rate (max)
2,026
Spin Rate (avg)
IVB (max)
IVB (avg)
HM (max)
HM (avg)
Extension (avg)
Release Ht (avg)
Spin Score (max)
Zone %
Trackman - Curveball
65.0
Velocity (max)
62.5 - 65.0
Velo Range
61.9
Eff Velocity (avg)
2,003
Spin Rate (max)
1,999
Spin Rate (avg)
IVB (max)
IVB (avg)
HM (max)
HM (avg)
Extension (avg)
Release Ht (avg)
Spin Score (max)
Trackman - ChangeUp
67.8
Velocity (max)
67.3 - 67.8
Velo Range
66.4
Eff Velocity (avg)
1,562
Spin Rate (max)
1,538
Spin Rate (avg)
IVB (max)
IVB (avg)
HM (max)
HM (avg)
Extension (avg)
Release Ht (avg)
Spin Score (max)
2021 Baseball U - PA Scout Day (Preseason)
Feb 15, 2021
Trackman - Fastball
76.1
Velocity (max)
74.1 - 75.5
Velo Range
74.5
Eff Velocity (avg)
1,787
Spin Rate (max)
1,720
Spin Rate (avg)
IVB (max)
IVB (avg)
HM (max)
HM (avg)
Extension (avg)
Release Ht (avg)
Spin Score (max)
Zone %
Trackman - Curveball
62.2
Velocity (max)
59.5 - 62.2
Velo Range
59.4
Eff Velocity (avg)
1,885
Spin Rate (max)
1,782
Spin Rate (avg)
IVB (max)
IVB (avg)
HM (max)
HM (avg)
Extension (avg)
Release Ht (avg)
Spin Score (max)
Trackman - ChangeUp
67.6
Velocity (max)
65.0 - 67.3
Velo Range
65.9
Eff Velocity (avg)
1,595
Spin Rate (max)
1,562
Spin Rate (avg)
IVB (max)
IVB (avg)
HM (max)
HM (avg)
Extension (avg)
Release Ht (avg)
Spin Score (max)
Zone %
Pitch Scores
2021
Fastball
Hop+
A fastball with hop has a flat approach angle and visually jumps through the zone. When thrown up in the zone, it is more likely to generate a higher swing and miss average. Hop+ of 100 is MLB average.
Fastball
Sink+
A fastball with sink has low backspin and drops through the strike zone. When thrown down in the zone, it is more likely to generate a higher ground ball percentage and lower launch angle. Sink+ of 100 is MLB average.
Fastball
Rise+
A fastball with rise has a high percentage of backspin. When thrown up in the zone, it is more likely to generate a higher fly ball percentage. Rise+ of 100 is MLB average
Pitching Velos
2021
2020
Fastball
Velocity Max
The maximum observed fastball velocity in the given event year. Measured in miles per hour (MPH).
76.0
Fastball
Velocity Avg
The average velocity for all pitches of this type in the given event year. Measured in miles per hour (MPH)
74.5
Curveball
Velocity Avg
The average velocity for all pitches of this type in the given event year. Measured in miles per hour (MPH)
60.5
Changeup
Velocity Avg
The average velocity for all pitches of this type in the given event year. Measured in miles per hour (MPH)
66.5
Fastball
Velocity Max
The maximum observed fastball velocity in the given event year. Measured in miles per hour (MPH).
66.0
Fastball
Velocity Avg
The average velocity for all pitches of this type in the given event year. Measured in miles per hour (MPH)
65.0
Curveball
Velocity Avg
The average velocity for all pitches of this type in the given event year. Measured in miles per hour (MPH)
51.5
Changeup
Velocity Avg
The average velocity for all pitches of this type in the given event year. Measured in miles per hour (MPH)
57.5
Game Performance

2022
10 Yard Dash
The athlete's fastest 0-10-yard split time in the given event year. Measured in seconds.
1.79
30 Yard Dash
The athlete's fastest 0-30-yard split time in the given event year. Measured in seconds.
4.05
60 Yard Dash
The athlete's fastest 0-60-yard time in the given event year. Measured in seconds.
7.19
Top Speed (MPH)
The athlete's fastest split time converted to miles per hour.
Vertical Jump
A measure of any athlete's body strength and reach calculated from the flight time divided by the contact time.
2022 PA Interstate Games
Oct 1, 2022
Swift
1.60
RSi (max)
2.13
RSi (avg)
1,781
Jump Power (max)
29.2
Jump Height (max)
29.1
Jump Height (avg)
2022 Northeast Senior Games
Aug 9, 2022
Swift
1.79
10-yd
4.05
30-yd
7.19
60-yd
19.6
Run speed (max)
8.3
Run Speed (avg)
1.86
RSi (max)
1.86
RSi (avg)
1,756
Jump Power (max)
28.7
Jump Height (max)
27.5
Jump Height (avg)
Visual Edge

2022
Edge Score
The highest Edge Score within the given year. Edge Score is a comprehensive score that takes the core-six visual skills into account, providing an assessment of an athlete’s overall visual ability.
76.94
Pitch Ai

Notes
News
Comments
Draft Reports
Contact
Premium Content Area
To unlock contact information, you need to purchase a ScoutPLUS subscription.
Purchase Subscription OR
Login








 Sign in to view rankings
Physical: Longer-framed, leveraged 6-foot-2, 190lb build. 7.46 runner in the 60.
Offensively: RHH. Spread, slightly open stance, as the knob starts over the point of the plate. Utilized a simple leg-lift stride to initiate the swing through a flat, rotational path with connected parts into the hitting zone. Mostly pull-side approach that split the LCF gap for extra-bases, up to a T93 mph exit velocity. Delivered a 299 foot max distance from a regular effort.
Defensively: The first baseman begins with taller posture, working beneath the ball using a soft glove-hand off his left foot. Adequate feel around the bag, squaring the hips after the exchange for an 82 mph arm-strength across the dirt (H ¾ slot).
Physical: Projectable, high-waisted 6-foot-2, 190lb build. 7.19 runner in the 60.
Offensively: RHH. Slightly bent, even stance with loose elbows to start. Utilized a short leg-kick stride to initiate the swing through a whippy path that lifted towards the finish. Squeezed the rear hip on the turn for a leveraged, pull-side approach, up to a T93 mph exit velocity via Trackman. Created backspin often and did damage on pitches thrown out over the plate. Developing power in the box (299 feet).
Defensively: The primary first baseman showed off adequate feel around the bag, keeping a flat back with a soft glove-hand present. Fielded off his left side using one hand mostly and flashed a drop-step technique on the double-play. Recorded an 82 mph arm-strength across the dirt (H ¾).
Physical: High-waisted, broad-shouldered 6-foot-2, 190lb frame. 6.98 runner in the 60-yard dash.
Offensively: RHH. Comfortable, slightly bent stance at even, as the hands operated quietly at the shoulder. Utilized a leg lift stride to initiate the swing through a connected, uphill path into the hitting zone, producing hard fly ball contact to the LCF gap. Showed off advanced bat-speed while working to a leveraged position at the front of the plate; recorded a T93 mph bat-exit velocity.
Defensively: The first baseman demonstrated enough feel to stick positionally and set down on the ball from a wider base. A soft glove hand picked out correct hops to push/pull on, allowing for a live 83 mph arm on the front side from H ¾ slot.