CLASS OF 2024
SS
2B
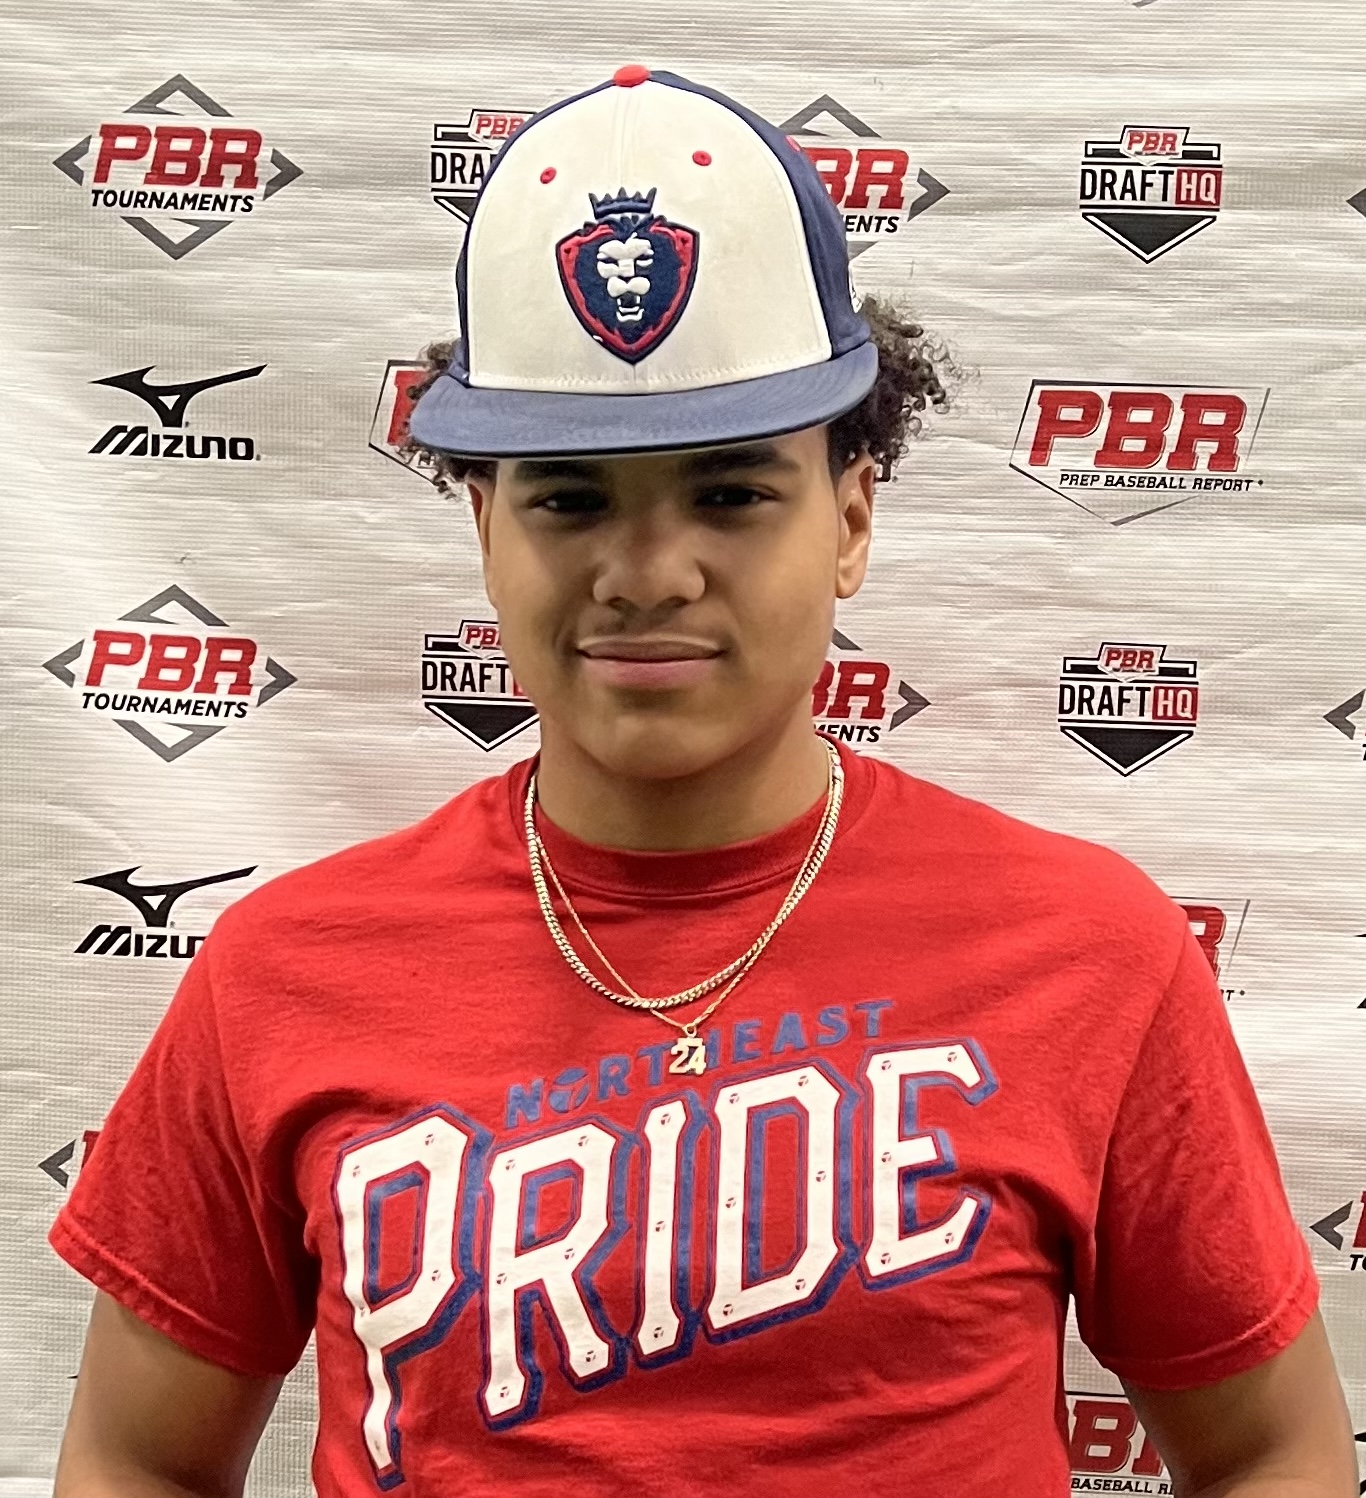
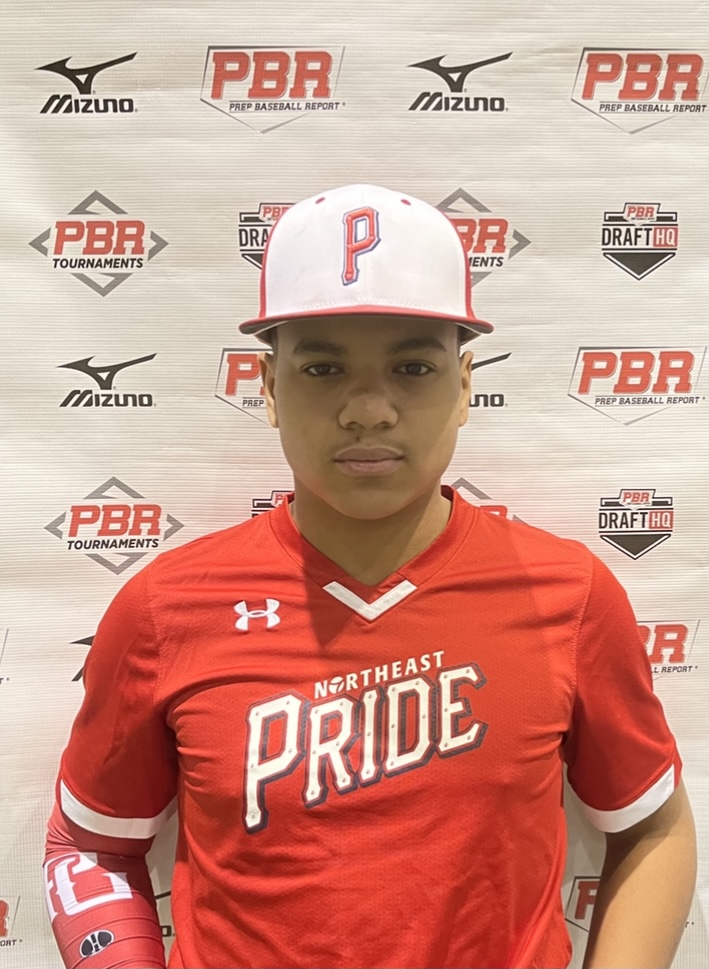
Tariq
Moore Jr
Southern
Williamsport Area (HS) • PA
5' 10" • 185LBS
R/R • 19yr 9mo
Travel Team: NEpride 2024 national team
Williamsport Area (HS) • PA
5' 10" • 185LBS
R/R • 19yr 9mo
Travel Team: NEpride 2024 national team
Rankings
2024 National
Rankings available to Premium Subscriber
2024 State
Rankings available to Premium Subscriber
Commitment
Best Of Stats
25.8
Hand Speed (max)
10/24/20
70.9
Bat Speed (max)
6/08/22
33.3
Rot. Acc (max)
3/04/23
45
Hard Hit %
3/04/23
94.9
Exit Velocity (max)
3/04/23
88.1
Exit Velocity (avg)
3/04/23
334
Distance (max)
6/08/22
82
Sweet Spot %
10/24/21
7.45
60
6/08/22
-
30-yd
-
10-yd
16.5
Run speed (max)
6/08/22
81
INF Velo
3/04/23
-
OF Velo
-
C Velo
-
Pop Time
Positional Tools
2023
2022
2021
2020
Infield Velocity
The athlete's maximum throwing velocity from an infield position in the given event year. Measured in miles per hour (MPH).
81.0
Infield Velocity
The athlete's maximum throwing velocity from an infield position in the given event year. Measured in miles per hour (MPH).
79.0
60 Yard Dash
The athlete's fastest 60-yard dash time in the given event year. Measured in seconds (s)
7.58
Infield Velocity
The athlete's maximum throwing velocity from an infield position in the given event year. Measured in miles per hour (MPH).
76.0
Power / Speed Score
A simple calculation that divides the athlete’s Exit Velocity Max by the athlete’s 60 Yard Dash time for the given event year. For example, 98 MPH / 7.00s = 14.00.
11.1
60 Yard Dash
The athlete's fastest 60-yard dash time in the given event year. Measured in seconds (s)
7.63
Infield Velocity
The athlete's maximum throwing velocity from an infield position in the given event year. Measured in miles per hour (MPH).
71.0
Power / Speed Score
A simple calculation that divides the athlete’s Exit Velocity Max by the athlete’s 60 Yard Dash time for the given event year. For example, 98 MPH / 7.00s = 14.00.
10.5
Hitting

2023
2022
2021
2020
Exit Velocity Max
The highest exit velocity of any batted ball in the given event year. Measured in miles per hour (MPH).
94.9
Exit Velocity Avg
Average exit velocity of all batted balls in the given event year. Measured in miles per hour (MPH).
88.1
Distance Max
The highest flight distance of any batted ball in the given event year. Measured in feet (ft).
312
Distance Avg
Average flight distance of all batted balls in the given event year. Measured in feet (ft).
182
Launch Angle Avg
Average launch angle of all batted balls in the given event year. Measured in degrees.
17.8
Hard Hit %
Percentage of batted balls with exit velocities over 95 MPH in the given event year.
Sweet Spot %
Percentage of batted balls in the given event year with a launch angle between 8° and 32°.
Line Drive %
Percentage of batted balls with launch angles between 10 and 25 degrees in the given event year.
Fly Ball %
Percentage of batted balls with launch angles between 25 and 50 degrees in the given event year.
Ground Ball %
Percentage of batted balls with launch angles below 10 degrees in the given event year.
Exit Velocity Max
The highest exit velocity of any batted ball in the given event year. Measured in miles per hour (MPH).
90.6
Exit Velocity Avg
Average exit velocity of all batted balls in the given event year. Measured in miles per hour (MPH).
81.6
Distance Max
The highest flight distance of any batted ball in the given event year. Measured in feet (ft).
334
Distance Avg
Average flight distance of all batted balls in the given event year. Measured in feet (ft).
197
Launch Angle Avg
Average launch angle of all batted balls in the given event year. Measured in degrees.
18.9
Hard Hit %
Percentage of batted balls with exit velocities over 95 MPH in the given event year.
Sweet Spot %
Percentage of batted balls in the given event year with a launch angle between 8° and 32°.
Line Drive %
Percentage of batted balls with launch angles between 10 and 25 degrees in the given event year.
Fly Ball %
Percentage of batted balls with launch angles between 25 and 50 degrees in the given event year.
Ground Ball %
Percentage of batted balls with launch angles below 10 degrees in the given event year.
Exit Velocity Max
The highest exit velocity of any batted ball in the given event year. Measured in miles per hour (MPH).
84.4
Exit Velocity Avg
Average exit velocity of all batted balls in the given event year. Measured in miles per hour (MPH).
75.1
Distance Max
The highest flight distance of any batted ball in the given event year. Measured in feet (ft).
306
Distance Avg
Average flight distance of all batted balls in the given event year. Measured in feet (ft).
180
Launch Angle Avg
Average launch angle of all batted balls in the given event year. Measured in degrees.
18.9
Hard Hit %
Percentage of batted balls with exit velocities over 95 MPH in the given event year.
Sweet Spot %
Percentage of batted balls in the given event year with a launch angle between 8° and 32°.
Line Drive %
Percentage of batted balls with launch angles between 10 and 25 degrees in the given event year.
Fly Ball %
Percentage of batted balls with launch angles between 25 and 50 degrees in the given event year.
Ground Ball %
Percentage of batted balls with launch angles below 10 degrees in the given event year.
Exit Velocity Max
The highest exit velocity of any batted ball in the given event year. Measured in miles per hour (MPH).
80.4
Exit Velocity Avg
Average exit velocity of all batted balls in the given event year. Measured in miles per hour (MPH).
74.3
Distance Max
The highest flight distance of any batted ball in the given event year. Measured in feet (ft).
275
Distance Avg
Average flight distance of all batted balls in the given event year. Measured in feet (ft).
159
Launch Angle Avg
Average launch angle of all batted balls in the given event year. Measured in degrees.
17.2
Hard Hit %
Percentage of batted balls with exit velocities over 95 MPH in the given event year.
Sweet Spot %
Percentage of batted balls in the given event year with a launch angle between 8° and 32°.
Line Drive %
Percentage of batted balls with launch angles between 10 and 25 degrees in the given event year.
Fly Ball %
Percentage of batted balls with launch angles between 25 and 50 degrees in the given event year.
Ground Ball %
Percentage of batted balls with launch angles below 10 degrees in the given event year.
2023 Northeast Pride Scout Day (Preseason)
Mar 4, 2023
Trackman - Hitting
94.9
Exit Velocity (max)
88.1
Exit Velocity (avg)
182
Distance (avg)
312
Distance (max)
Hard Hit %
Sweet Spot %
Line Drive %
Fly Ball %
Ground Ball %
2022 Northeast Pride Scout Day (Summer)
Jun 8, 2022
Trackman - Hitting
90.6
Exit Velocity (max)
84.0
Exit Velocity (avg)
245
Distance (avg)
334
Distance (max)
Hard Hit %
Sweet Spot %
Line Drive %
Fly Ball %
2022 Northeast Pride Scout Day (Preseason)
Mar 6, 2022
Trackman - Hitting
85.9
Exit Velocity (max)
79.4
Exit Velocity (avg)
154
Distance (avg)
285
Distance (max)
Sweet Spot %
Line Drive %
Fly Ball %
Ground Ball %
2021 Northeast Pride Scout Day (Fall)
Oct 24, 2021
Trackman - Hitting
82.3
Exit Velocity (max)
77.6
Exit Velocity (avg)
208
Distance (avg)
293
Distance (max)
Sweet Spot %
Line Drive %
Fly Ball %
Ground Ball %
2021 PA State Games / 2023-2024 Grads
Jun 15, 2021
Trackman - Hitting
84.4
Exit Velocity (max)
73.6
Exit Velocity (avg)
180
Distance (avg)
306
Distance (max)
Sweet Spot %
Line Drive %
Fly Ball %
Ground Ball %
2021 Northeast Pride Scout Day (Summer)
Jun 10, 2021
Trackman - Hitting
83.9
Exit Velocity (max)
76.9
Exit Velocity (avg)
200
Distance (avg)
305
Distance (max)
Sweet Spot %
Line Drive %
Fly Ball %
Ground Ball %
2021 Northeast Pride Scout Day (Preseason)
Mar 7, 2021
Trackman - Hitting
82.9
Exit Velocity (max)
72.3
Exit Velocity (avg)
133
Distance (avg)
249
Distance (max)
Sweet Spot %
Line Drive %
Fly Ball %
Ground Ball %
2020 Northeast Pride Scout Day (Fall)
Oct 24, 2020
Trackman - Hitting
80.4
Exit Velocity (max)
75.3
Exit Velocity (avg)
175
Distance (avg)
252
Distance (max)
Sweet Spot %
Line Drive %
Fly Ball %
Ground Ball %
2020 Jr. PA State Games
Jun 29, 2020
Trackman - Hitting
76.7
Exit Velocity (max)
73.5
Exit Velocity (avg)
147
Distance (avg)
275
Distance (max)
Sweet Spot %
Line Drive %
Fly Ball %
Ground Ball %
Hitting

2023
2022
2021
2020
Hand Speed Max
The highest Peak Hand Speed of any swing in the given event year.
22.1
Hand Speed Avg
The average Peak Hand Speed for all swings in the given event year.
21.3
Bat Speed Max
The highest Bat Speed of any swing in the given event year.
68.2
Bat Speed Avg
The average Bat Speed for all swings in the given event year.
67.4
Rotational Acceleration Max
The highest Rotational Acceleration of any swing in the given event year.
Rotational Acceleration Avg
The average Rotational Acceleration for all swings in the given event year.
On-Plane Efficiency Max
The highest On-Plane Efficiency of any swing in the given event year.
On-Plane Efficiency Avg
The average On-Plane Efficiency for all swings in the given event year.
Hand Speed Max
The highest Peak Hand Speed of any swing in the given event year.
25.4
Hand Speed Avg
The average Peak Hand Speed for all swings in the given event year.
22.7
Bat Speed Max
The highest Bat Speed of any swing in the given event year.
70.9
Bat Speed Avg
The average Bat Speed for all swings in the given event year.
66.1
Rotational Acceleration Max
The highest Rotational Acceleration of any swing in the given event year.
Rotational Acceleration Avg
The average Rotational Acceleration for all swings in the given event year.
On-Plane Efficiency Max
The highest On-Plane Efficiency of any swing in the given event year.
On-Plane Efficiency Avg
The average On-Plane Efficiency for all swings in the given event year.
Hand Speed Max
The highest Peak Hand Speed of any swing in the given event year.
24.0
Hand Speed Avg
The average Peak Hand Speed for all swings in the given event year.
20.6
Bat Speed Max
The highest Bat Speed of any swing in the given event year.
65.4
Bat Speed Avg
The average Bat Speed for all swings in the given event year.
60.9
Rotational Acceleration Max
The highest Rotational Acceleration of any swing in the given event year.
Rotational Acceleration Avg
The average Rotational Acceleration for all swings in the given event year.
On-Plane Efficiency Max
The highest On-Plane Efficiency of any swing in the given event year.
On-Plane Efficiency Avg
The average On-Plane Efficiency for all swings in the given event year.
Hand Speed Max
The highest Peak Hand Speed of any swing in the given event year.
25.8
Hand Speed Avg
The average Peak Hand Speed for all swings in the given event year.
24.3
Bat Speed Max
The highest Bat Speed of any swing in the given event year.
60.5
Bat Speed Avg
The average Bat Speed for all swings in the given event year.
57.3
Rotational Acceleration Max
The highest Rotational Acceleration of any swing in the given event year.
Rotational Acceleration Avg
The average Rotational Acceleration for all swings in the given event year.
On-Plane Efficiency Max
The highest On-Plane Efficiency of any swing in the given event year.
On-Plane Efficiency Avg
The average On-Plane Efficiency for all swings in the given event year.
2023 Northeast Pride Scout Day (Preseason)
Mar 4, 2023
Blast - Hitting
22.1
Hand Speed (max)
21.3
Hand Speed (avg)
68.2
Bat Speed (max)
67.4
Bat Speed (avg)
Rot. Acc (max)
Rot. Acc (avg)
On Plane Eff (avg)
MaxOnPlaneEfficiency
2022 Northeast Pride Scout Day (Summer)
Jun 8, 2022
Blast - Hitting
25.4
Hand Speed (max)
24.4
Hand Speed (avg)
70.9
Bat Speed (max)
67.1
Bat Speed (avg)
Rot. Acc (max)
Rot. Acc (avg)
On Plane Eff (avg)
MaxOnPlaneEfficiency
2022 Northeast Pride Scout Day (Preseason)
Mar 6, 2022
Blast - Hitting
22.9
Hand Speed (max)
21.3
Hand Speed (avg)
68.9
Bat Speed (max)
65.3
Bat Speed (avg)
Rot. Acc (max)
Rot. Acc (avg)
On Plane Eff (avg)
MaxOnPlaneEfficiency
2021 Northeast Pride Scout Day (Fall)
Oct 24, 2021
Blast - Hitting
24.0
Hand Speed (max)
22.4
Hand Speed (avg)
65.4
Bat Speed (max)
63.5
Bat Speed (avg)
Rot. Acc (max)
Rot. Acc (avg)
On Plane Eff (avg)
MaxOnPlaneEfficiency
2021 PA State Games / 2023-2024 Grads
Jun 15, 2021
Blast - Hitting
21.9
Hand Speed (max)
20.4
Hand Speed (avg)
63.3
Bat Speed (max)
61.0
Bat Speed (avg)
Rot. Acc (max)
Rot. Acc (avg)
On Plane Eff (avg)
MaxOnPlaneEfficiency
2021 Northeast Pride Scout Day (Summer)
Jun 10, 2021
Blast - Hitting
23.8
Hand Speed (max)
21.1
Hand Speed (avg)
65.4
Bat Speed (max)
62.5
Bat Speed (avg)
Rot. Acc (max)
Rot. Acc (avg)
On Plane Eff (avg)
2021 Northeast Pride Scout Day (Preseason)
Mar 7, 2021
Blast - Hitting
20.0
Hand Speed (max)
18.7
Hand Speed (avg)
61.6
Bat Speed (max)
57.5
Bat Speed (avg)
Rot. Acc (max)
Rot. Acc (avg)
On Plane Eff (avg)
MaxOnPlaneEfficiency
2020 Northeast Pride Scout Day (Fall)
Oct 24, 2020
Blast - Hitting
25.8
Hand Speed (max)
24.3
Hand Speed (avg)
60.5
Bat Speed (max)
57.3
Bat Speed (avg)
Rot. Acc (max)
Rot. Acc (avg)
On Plane Eff (avg)
MaxOnPlaneEfficiency
2020 Jr. PA State Games
Jun 29, 2020
Blast - Hitting
22.4
Hand Speed (max)
20.9
Hand Speed (avg)
58.6
Bat Speed (max)
55.7
Bat Speed (avg)
Rot. Acc (max)
Rot. Acc (avg)
On Plane Eff (avg)
Pitching

Pitch Scores
Pitching Velos
Game Performance

2022
60 Yard Dash
The athlete's fastest 0-60-yard time in the given event year. Measured in seconds.
7.45
Top Speed (MPH)
The athlete's fastest split time converted to miles per hour.
Visual Edge

2021
Edge Score
The highest Edge Score within the given year. Edge Score is a comprehensive score that takes the core-six visual skills into account, providing an assessment of an athlete’s overall visual ability.
77.26
Pitch Ai

Notes
News
Comments
Draft Reports
Contact
Premium Content Area
To unlock contact information, you need to purchase a ScoutPLUS subscription.
Purchase Subscription OR
Login











 Sign in to view rankings
Physical: Athletic, projectable 5-foot-9, 165lb frame with even proportions and some durability present. 7.77 runner in the 60-yard dash.
Offensively: RHH - Slightly open stance bent into the backside with a high-hand start to begin; utilized an early leg lift stride, finding the ground on time while initiating through a quick, slightly uphill path into the hitting zone. Featured above-average bat control, driving the ball repeatedly on a line through the middle of the field (40% line drive rate via Trackman) and added a 306 foot batted ball distance on his best swing to LCF in the air. Natural connection that carries over to game action (20 G’s rotational acceleration per Blast) hinting at additional juice on the way soon. Worked his way up to a T84 mph bat-exit velocity with room for more.
Defensively: The primary middle infielder demonstrated quick, active feet to start getting to a levered right to left position down through the fielding window with a soft glove hand. Stalking actions at times and average pace during defensive evaluations, releasing accurately from a high ¾ slot after a glove-tap (T72 mph arm strength). Handled the play on the run with grace, dropping down slightly with ability to manipulate arm angles.
Physical: Durable / athletic 5-foot-7, 170-pound frame with advanced strength throughout the movements. 7.72 runner in the 60-yard dash. Offensively: RHH. Tall, slightly open stance with the hands showing controlled bounce off of the shoulder out of a low setup. Utilized a leg-lift stride coupled with a move up above the shoulder towards launch in order to initiate an efficient, slightly uphill barrel path into the hitting zone. Demonstrated plenty of fluidity in the swing with ability to continuously get off large hacks in game action, high level bat to ball skills only helped the case with a short time to contact at the plate, regularly barreled the baseball up on time at the front of the plate and lived gap to gap primarily in the LCF gap. Strong lower half that led the swing and allowed hands to match the pitch plane early and often, recorded a peak bat-exit velocity of 83 mph per Trackman Baseball. Defensively: The primary shortstop featured active footwork with ability to get downhill through the baseball at the fielding window. Approached the baseball fielding off of his left side with a soft glove hand, repeatable transfers after funneling, accurate high ¾ arm-slot with quickness and a short arm circle. Projects the best at 2B with ability to impact the game substantially with the bat. INF - 70 mph
Physical: 5-foot-7, 162 pounds; strong, athletic frame. 7.63 runner in the 60. Offensively: RHH. Slightly open shoulder width stance; lifts hands behind head with an exaggerated leg kick. strong lower half, turns and stays behind the ball well with moderate length. Backspin balls to the pull side; peak Trackman exit velocity of 77 MPH. Defensively: Walks into pre-pitch position; choppy approach, active footwork to come around the ball. soft hands with clean transfer; long arm swing with standard 3/4 arm slot. INF - 65 MPH.
5-foot-7, 155-pound right-handed hitter starts from a square stance and uses a leg-lift stride to begin. Stays behind the baseball well and creates routine back spin with a feel for the barrel. Registered a 70 mph bat exit velocity and ran a 7.84 60-yard dash. Showcased confident defensive actions in the infield with accurate 70 mph arm strength across the diamond.