CLASS OF 2023
OF
RHP
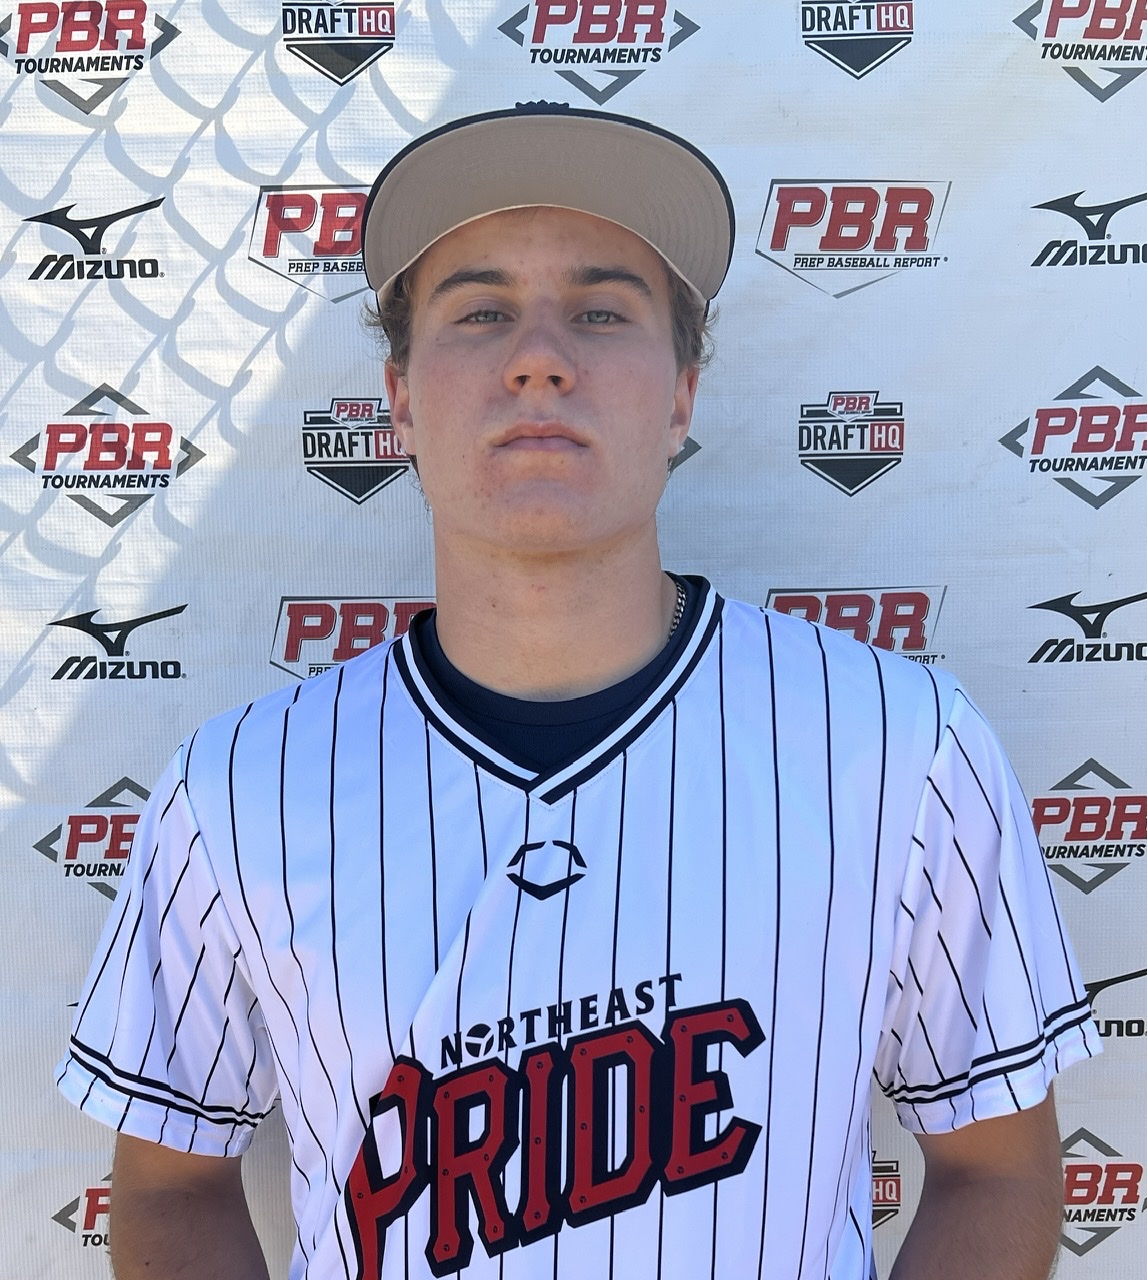
Aidan
Paduck
Misericordia University
Tunkhannock Area (HS) • PA
5' 10" • 165LBS
R/R • 19yr 7mo
Travel Team: Northeast Pride
Tunkhannock Area (HS) • PA
5' 10" • 165LBS
R/R • 19yr 7mo
Travel Team: Northeast Pride
Rankings
2023 National
Rankings available to Premium Subscriber
2023 State
Rankings available to Premium Subscriber
Commitment
Best Of Stats
23.9
Hand Speed (max)
6/14/22
72.8
Bat Speed (max)
6/14/22
26
Rot. Acc (max)
6/14/22
-
Hard Hit %
89.8
Exit Velocity (max)
6/08/22
81.9
Exit Velocity (avg)
6/08/22
301
Distance (max)
6/14/22
88
Sweet Spot %
6/08/22
6.83
60
10/16/21
-
30-yd
-
10-yd
17.7
Run speed (max)
6/08/22
82
INF Velo
10/16/21
88
OF Velo
10/16/21
-
C Velo
-
Pop Time
Fastball
82
Velocity (max)
10/16/21
78.6 - 80.8
Velo Range
6/08/22
2104
Spin Rate (avg)
2/23/21
Changeup
70 - 71
Velo Range
2/23/21
1832
Spin Rate (avg)
2/23/21
Curveball
69 - 72
Velo Range
8/29/20
1733
Spin Rate (avg)
2/23/21
Slider
70.7 - 71.9
Velo Range
6/08/22
1718
Spin Rate (avg)
10/16/21
Positional Tools
2022
2021
60 Yard Dash
The athlete's fastest 60-yard dash time in the given event year. Measured in seconds (s)
6.87
Outfield Velocity
The athlete's maximum throwing velocity from an outfield position in the given event year. Measured in miles per hour (MPH).
87.0
Power / Speed Score
A simple calculation that divides the athlete’s Exit Velocity Max by the athlete’s 60 Yard Dash time for the given event year. For example, 98 MPH / 7.00s = 14.00.
13.1
60 Yard Dash
The athlete's fastest 60-yard dash time in the given event year. Measured in seconds (s)
6.83
Infield Velocity
The athlete's maximum throwing velocity from an infield position in the given event year. Measured in miles per hour (MPH).
82.0
Outfield Velocity
The athlete's maximum throwing velocity from an outfield position in the given event year. Measured in miles per hour (MPH).
88.0
Power / Speed Score
A simple calculation that divides the athlete’s Exit Velocity Max by the athlete’s 60 Yard Dash time for the given event year. For example, 98 MPH / 7.00s = 14.00.
12.9
Hitting

2022
2021
Exit Velocity Max
The highest exit velocity of any batted ball in the given event year. Measured in miles per hour (MPH).
89.8
Exit Velocity Avg
Average exit velocity of all batted balls in the given event year. Measured in miles per hour (MPH).
79.0
Distance Max
The highest flight distance of any batted ball in the given event year. Measured in feet (ft).
301
Distance Avg
Average flight distance of all batted balls in the given event year. Measured in feet (ft).
224
Launch Angle Avg
Average launch angle of all batted balls in the given event year. Measured in degrees.
26.8
Hard Hit %
Percentage of batted balls with exit velocities over 95 MPH in the given event year.
Sweet Spot %
Percentage of batted balls in the given event year with a launch angle between 8° and 32°.
Line Drive %
Percentage of batted balls with launch angles between 10 and 25 degrees in the given event year.
Fly Ball %
Percentage of batted balls with launch angles between 25 and 50 degrees in the given event year.
Ground Ball %
Percentage of batted balls with launch angles below 10 degrees in the given event year.
Exit Velocity Max
The highest exit velocity of any batted ball in the given event year. Measured in miles per hour (MPH).
88.2
Exit Velocity Avg
Average exit velocity of all batted balls in the given event year. Measured in miles per hour (MPH).
74.4
Distance Max
The highest flight distance of any batted ball in the given event year. Measured in feet (ft).
262
Distance Avg
Average flight distance of all batted balls in the given event year. Measured in feet (ft).
114
Launch Angle Avg
Average launch angle of all batted balls in the given event year. Measured in degrees.
9.9
Hard Hit %
Percentage of batted balls with exit velocities over 95 MPH in the given event year.
Sweet Spot %
Percentage of batted balls in the given event year with a launch angle between 8° and 32°.
Line Drive %
Percentage of batted balls with launch angles between 10 and 25 degrees in the given event year.
Fly Ball %
Percentage of batted balls with launch angles between 25 and 50 degrees in the given event year.
Ground Ball %
Percentage of batted balls with launch angles below 10 degrees in the given event year.
2022 PA State Games (Session 2)
Jun 14, 2022
Trackman - Hitting
88.5
Exit Velocity (max)
77.1
Exit Velocity (avg)
227
Distance (avg)
301
Distance (max)
Sweet Spot %
Line Drive %
Fly Ball %
2022 Northeast Pride Scout Day (Summer)
Jun 8, 2022
Trackman - Hitting
89.8
Exit Velocity (max)
81.9
Exit Velocity (avg)
239
Distance (avg)
299
Distance (max)
Sweet Spot %
Line Drive %
2022 Northeast Pride Scout Day (Preseason)
Mar 6, 2022
Trackman - Hitting
87.1
Exit Velocity (max)
78.6
Exit Velocity (avg)
208
Distance (avg)
276
Distance (max)
Sweet Spot %
Line Drive %
Fly Ball %
Ground Ball %
2021 Northeast Expos Scout Day (Fall)
Oct 16, 2021
Trackman - Hitting
88.2
Exit Velocity (max)
80.7
Exit Velocity (avg)
90
Distance (avg)
258
Distance (max)
Sweet Spot %
Line Drive %
Ground Ball %
2021 East Coast Sandhogs/Northeast Expos Scout Day (Winter)
Feb 23, 2021
Trackman - Hitting
83.9
Exit Velocity (max)
67.6
Exit Velocity (avg)
140
Distance (avg)
262
Distance (max)
Sweet Spot %
Line Drive %
Fly Ball %
Ground Ball %
Hitting

2022
2021
Hand Speed Max
The highest Peak Hand Speed of any swing in the given event year.
23.9
Hand Speed Avg
The average Peak Hand Speed for all swings in the given event year.
21.8
Bat Speed Max
The highest Bat Speed of any swing in the given event year.
72.8
Bat Speed Avg
The average Bat Speed for all swings in the given event year.
67.8
Rotational Acceleration Max
The highest Rotational Acceleration of any swing in the given event year.
Rotational Acceleration Avg
The average Rotational Acceleration for all swings in the given event year.
On-Plane Efficiency Max
The highest On-Plane Efficiency of any swing in the given event year.
On-Plane Efficiency Avg
The average On-Plane Efficiency for all swings in the given event year.
Hand Speed Max
The highest Peak Hand Speed of any swing in the given event year.
23.1
Hand Speed Avg
The average Peak Hand Speed for all swings in the given event year.
20.4
Bat Speed Max
The highest Bat Speed of any swing in the given event year.
70.8
Bat Speed Avg
The average Bat Speed for all swings in the given event year.
65.8
Rotational Acceleration Max
The highest Rotational Acceleration of any swing in the given event year.
Rotational Acceleration Avg
The average Rotational Acceleration for all swings in the given event year.
On-Plane Efficiency Max
The highest On-Plane Efficiency of any swing in the given event year.
On-Plane Efficiency Avg
The average On-Plane Efficiency for all swings in the given event year.
2022 PA State Games (Session 2)
Jun 14, 2022
Blast - Hitting
23.9
Hand Speed (max)
21.9
Hand Speed (avg)
72.8
Bat Speed (max)
69.3
Bat Speed (avg)
Rot. Acc (max)
Rot. Acc (avg)
On Plane Eff (avg)
MaxOnPlaneEfficiency
2022 Northeast Pride Scout Day (Summer)
Jun 8, 2022
Blast - Hitting
22.3
Hand Speed (max)
21.6
Hand Speed (avg)
69.2
Bat Speed (max)
67.4
Bat Speed (avg)
Rot. Acc (max)
Rot. Acc (avg)
On Plane Eff (avg)
MaxOnPlaneEfficiency
2022 Northeast Pride Scout Day (Preseason)
Mar 6, 2022
Blast - Hitting
23.6
Hand Speed (max)
21.9
Hand Speed (avg)
71.4
Bat Speed (max)
66.6
Bat Speed (avg)
Rot. Acc (max)
Rot. Acc (avg)
On Plane Eff (avg)
MaxOnPlaneEfficiency
2021 Northeast Expos Scout Day (Fall)
Oct 16, 2021
Blast - Hitting
23.1
Hand Speed (max)
20.8
Hand Speed (avg)
70.8
Bat Speed (max)
66.9
Bat Speed (avg)
Rot. Acc (max)
Rot. Acc (avg)
On Plane Eff (avg)
MaxOnPlaneEfficiency
2021 East Coast Sandhogs/Northeast Expos Scout Day (Winter)
Feb 23, 2021
Blast - Hitting
21.5
Hand Speed (max)
20.0
Hand Speed (avg)
67.5
Bat Speed (max)
64.5
Bat Speed (avg)
Rot. Acc (max)
Rot. Acc (avg)
On Plane Eff (avg)
MaxOnPlaneEfficiency
Pitching

2022
2021
Fastball
Velocity Max
The maximum observed fastball velocity in the given event year. Measured in miles per hour (MPH).
81.0
Fastball
Velocity Avg
The average velocity for all pitches of this type in the given event year. Measured in miles per hour (MPH).
79.7
Fastball
Spin Rate Avg
The average rate of spin for all pitches of this type in the given event year. Measured in rotations per minute (RPM).
2039
Fastball
Spin Score Avg
The average Bauer Units value of all fastballs in the given event year. Bauer Units are calculated for each pitch by dividing Spin Rate by Velocity.
25.6
Fastball
Total Movement Avg
The average total non-gravity movement for all pitches of this type in the given event year. Measured in inches (in).
Curveball
Velocity Avg
The average velocity for all pitches of this type in the given event year. Measured in miles per hour (MPH).
70.7
Curveball
Spin Rate Avg
The average rate of spin for all pitches of this type in the given event year. Measured in rotations per minute (RPM).
1586
Curveball
Total Movement Avg
The average total non-gravity movement for all pitches of this type in the given event year. Measured in inches (in).
Slider
Velocity Avg
The average velocity for all pitches of this type in the given event year. Measured in miles per hour (MPH).
71.3
Slider
Spin Rate Avg
The average rate of spin for all pitches of this type in the given event year. Measured in rotations per minute (RPM).
1686
Slider
Total Movement Avg
The average total non-gravity movement for all pitches of this type in the given event year. Measured in inches (in).
Fastball
Velocity Max
The maximum observed fastball velocity in the given event year. Measured in miles per hour (MPH).
81.7
Fastball
Velocity Avg
The average velocity for all pitches of this type in the given event year. Measured in miles per hour (MPH).
79.2
Fastball
Spin Rate Avg
The average rate of spin for all pitches of this type in the given event year. Measured in rotations per minute (RPM).
2061
Fastball
Spin Score Avg
The average Bauer Units value of all fastballs in the given event year. Bauer Units are calculated for each pitch by dividing Spin Rate by Velocity.
26.0
Fastball
Total Movement Avg
The average total non-gravity movement for all pitches of this type in the given event year. Measured in inches (in).
Curveball
Velocity Avg
The average velocity for all pitches of this type in the given event year. Measured in miles per hour (MPH).
67.7
Curveball
Spin Rate Avg
The average rate of spin for all pitches of this type in the given event year. Measured in rotations per minute (RPM).
1715
Curveball
Total Movement Avg
The average total non-gravity movement for all pitches of this type in the given event year. Measured in inches (in).
Changeup
Velocity Avg
The average velocity for all pitches of this type in the given event year. Measured in miles per hour (MPH).
70.2
Changeup
Spin Rate Avg
The average rate of spin for all pitches of this type in the given event year. Measured in rotations per minute (RPM).
1832
Changeup
Total Movement Avg
The average total non-gravity movement for all pitches of this type in the given event year. Measured in inches (in).
Slider
Velocity Avg
The average velocity for all pitches of this type in the given event year. Measured in miles per hour (MPH).
68.3
Slider
Spin Rate Avg
The average rate of spin for all pitches of this type in the given event year. Measured in rotations per minute (RPM).
1680
Slider
Total Movement Avg
The average total non-gravity movement for all pitches of this type in the given event year. Measured in inches (in).
2022 Northeast Pride Scout Day (Summer)
Jun 8, 2022
Trackman - Fastball
81.0
Velocity (max)
78.6 - 80.8
Velo Range
75.8
Eff Velocity (avg)
2,262
Spin Rate (max)
2,039
Spin Rate (avg)
IVB (max)
IVB (avg)
HM (max)
HM (avg)
Extension (avg)
Release Ht (avg)
Spin Score (max)
Zone %
Trackman - Curveball
72.0
Velocity (max)
70.0 - 71.6
Velo Range
66.2
Eff Velocity (avg)
1,743
Spin Rate (max)
1,586
Spin Rate (avg)
IVB (max)
IVB (avg)
HM (max)
HM (avg)
Extension (avg)
Release Ht (avg)
Spin Score (max)
Zone %
Trackman - Slider
71.9
Velocity (max)
70.7 - 71.9
Velo Range
66.6
Eff Velocity (avg)
1,713
Spin Rate (max)
1,686
Spin Rate (avg)
IVB (max)
IVB (avg)
HM (max)
HM (avg)
Extension (avg)
Release Ht (avg)
Spin Score (max)
Zone %
2021 Northeast Expos Scout Day (Fall)
Oct 16, 2021
Trackman - Fastball
81.7
Velocity (max)
78.1 - 80.6
Velo Range
74.2
Eff Velocity (avg)
2,233
Spin Rate (max)
2,025
Spin Rate (avg)
IVB (max)
IVB (avg)
HM (max)
HM (avg)
Extension (avg)
Release Ht (avg)
Spin Score (max)
Zone %
Trackman - Curveball
68.2
Velocity (max)
66.6 - 67.9
Velo Range
62.8
Eff Velocity (avg)
1,818
Spin Rate (max)
1,711
Spin Rate (avg)
IVB (max)
IVB (avg)
HM (max)
HM (avg)
Extension (avg)
Release Ht (avg)
Spin Score (max)
Trackman - Slider
67.6
Velocity (max)
62.7
Eff Velocity (avg)
1,718
Spin Rate (max)
1,718
Spin Rate (avg)
IVB (max)
IVB (avg)
HM (max)
HM (avg)
Extension (avg)
Release Ht (avg)
Spin Score (max)
2021 East Coast Sandhogs/Northeast Expos Scout Day (Winter)
Feb 23, 2021
Trackman - Fastball
80.1
Velocity (max)
78.0 - 79.9
Velo Range
75.6
Eff Velocity (avg)
2,259
Spin Rate (max)
2,104
Spin Rate (avg)
IVB (max)
IVB (avg)
HM (max)
HM (avg)
Extension (avg)
Release Ht (avg)
Spin Score (max)
Zone %
Trackman - Curveball
69.6
Velocity (max)
66.7
Eff Velocity (avg)
1,733
Spin Rate (max)
1,733
Spin Rate (avg)
IVB (max)
IVB (avg)
HM (max)
HM (avg)
Extension (avg)
Release Ht (avg)
Spin Score (max)
Trackman - Slider
72.0
Velocity (max)
66.2 - 71.5
Velo Range
63.3
Eff Velocity (avg)
1,755
Spin Rate (max)
1,668
Spin Rate (avg)
IVB (max)
IVB (avg)
HM (max)
HM (avg)
Extension (avg)
Release Ht (avg)
Spin Score (max)
Trackman - ChangeUp
70.7
Velocity (max)
69.7 - 70.7
Velo Range
67.0
Eff Velocity (avg)
1,832
Spin Rate (max)
1,832
Spin Rate (avg)
IVB (max)
IVB (avg)
HM (max)
HM (avg)
Extension (avg)
Release Ht (avg)
Spin Score (max)
Pitch Scores
Pitching Velos
2021
2020
Fastball
Velocity Max
The maximum observed fastball velocity in the given event year. Measured in miles per hour (MPH).
82.0
Fastball
Velocity Avg
The average velocity for all pitches of this type in the given event year. Measured in miles per hour (MPH)
78.7
Curveball
Velocity Avg
The average velocity for all pitches of this type in the given event year. Measured in miles per hour (MPH)
67.0
Changeup
Velocity Avg
The average velocity for all pitches of this type in the given event year. Measured in miles per hour (MPH)
70.5
Slider
Velocity Avg
The average velocity for all pitches of this type in the given event year. Measured in miles per hour (MPH)
67.0
Fastball
Velocity Max
The maximum observed fastball velocity in the given event year. Measured in miles per hour (MPH).
77.0
Fastball
Velocity Avg
The average velocity for all pitches of this type in the given event year. Measured in miles per hour (MPH)
75.0
Curveball
Velocity Avg
The average velocity for all pitches of this type in the given event year. Measured in miles per hour (MPH)
70.5
Game Performance

2022
60 Yard Dash
The athlete's fastest 0-60-yard time in the given event year. Measured in seconds.
6.94
Top Speed (MPH)
The athlete's fastest split time converted to miles per hour.
Visual Edge

2022
Edge Score
The highest Edge Score within the given year. Edge Score is a comprehensive score that takes the core-six visual skills into account, providing an assessment of an athlete’s overall visual ability.
60.94
Pitch Ai

Notes
News
Comments
Draft Reports
Contact
Premium Content Area
To unlock contact information, you need to purchase a ScoutPLUS subscription.
Purchase Subscription OR
Login







 Sign in to view rankings
Physical: Muscular, athletic 5-foot-10, 165lb frame. 6.87 runner in the 60-yard dash
Offensively: RHH. Upright, even stance, as the hands started pre-slotted at a 45. Utilized a stretched lift and replace stride to initiate the swing through a flat path into the hitting zone. Some tilt present at times on the rear hip, able to lift to the pull-side gap for distance (301 feet max). Recorded a 50/50 line drive, fly ball split, which produced extension at impact up to a T89 mph exit velocity via Trackman. More to come.
Defensively: The outfielder was a metrics darling, rounding the ball with an adjustable glove-hand inside and outside the frame. Delivered an 86 mph arm-strength positionally with fluid hips and a loose H ¾ slot.