CLASS OF 2025
RHP
OF
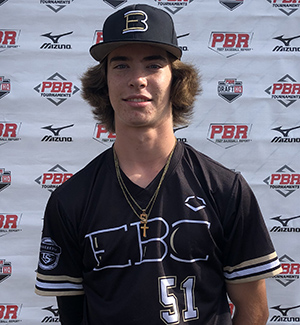
Landon
Harmon
East Union Attendance Center (HS) • MS
 6' 4" • 183.9LBS
R/R • 18yr 2mo
Travel Team: EBC 16U Mungle
R/R • 18yr 2mo
Travel Team: EBC 16U Mungle
Rankings
2025 National
Rankings available to Premium Subscriber
2025 State
Rankings available to Premium Subscriber
Commitment
Best Of Stats
Fastball
96.4
Velocity (max)
9/12/24
90 - 96
Velo Range
6/06/24
2700
Spin Rate (avg)
9/12/24
Changeup
88 - 90
Velo Range
9/15/23
2018
Spin Rate (avg)
9/12/24
Curveball
76 - 80
Velo Range
6/06/24
-
Spin Rate (avg)
Slider
75.8 - 80.7
Velo Range
9/12/24
2504
Spin Rate (avg)
9/12/24
88.3
Exit Velocity (max)
6/02/22
-
Exit Velocity (avg)
-
Distance (max)
-
Sweet Spot %
7.19
60
6/02/22
-
30-yd
-
10-yd
-
Run speed (max)
84
INF Velo
6/02/22
89
OF Velo
6/02/22
-
C Velo
-
Pop Time
Positional Tools
2022
2021
60 Yard Dash
The athlete's fastest 60-yard dash time in the given event year. Measured in seconds (s)
7.19
Infield Velocity
The athlete's maximum throwing velocity from an infield position in the given event year. Measured in miles per hour (MPH).
84.0
Outfield Velocity
The athlete's maximum throwing velocity from an outfield position in the given event year. Measured in miles per hour (MPH).
89.0
60 Yard Dash
The athlete's fastest 60-yard dash time in the given event year. Measured in seconds (s)
7.53
Infield Velocity
The athlete's maximum throwing velocity from an infield position in the given event year. Measured in miles per hour (MPH).
78.0
Outfield Velocity
The athlete's maximum throwing velocity from an outfield position in the given event year. Measured in miles per hour (MPH).
81.0
Power / Speed Score
A simple calculation that divides the athlete’s Exit Velocity Max by the athlete’s 60 Yard Dash time for the given event year. For example, 98 MPH / 7.00s = 14.00.
11.4
Hitting

2022
Exit Velocity Max
The highest exit velocity of any batted ball in the given event year. Measured in miles per hour (MPH).
88.3
Exit Velocity Avg
Average exit velocity of all batted balls in the given event year. Measured in miles per hour (MPH).
81.6
Distance Max
The highest flight distance of any batted ball in the given event year. Measured in feet (ft).
328
Distance Avg
Average flight distance of all batted balls in the given event year. Measured in feet (ft).
286
Launch Angle Avg
Average launch angle of all batted balls in the given event year. Measured in degrees.
37.7
Hard Hit %
Percentage of batted balls with exit velocities over 95 MPH in the given event year.
Sweet Spot %
Percentage of batted balls in the given event year with a launch angle between 8° and 32°.
Line Drive %
Percentage of batted balls with launch angles between 10 and 25 degrees in the given event year.
Fly Ball %
Percentage of batted balls with launch angles between 25 and 50 degrees in the given event year.
Ground Ball %
Percentage of batted balls with launch angles below 10 degrees in the given event year.
Easley Baseball Club Scout Day
Jun 2, 2022
Trackman - Hitting
88.3
Exit Velocity (max)
81.6
Exit Velocity (avg)
286
Distance (avg)
328
Distance (max)
Sweet Spot %
Fly Ball %
Hitting

Pitching

2024
2022
Fastball
Velocity Max
The maximum observed fastball velocity in the given event year. Measured in miles per hour (MPH).
96.4
Fastball
Velocity Avg
The average velocity for all pitches of this type in the given event year. Measured in miles per hour (MPH).
94.3
Fastball
Spin Rate Avg
The average rate of spin for all pitches of this type in the given event year. Measured in rotations per minute (RPM).
2700
Fastball
Spin Score Avg
The average Bauer Units value of all fastballs in the given event year. Bauer Units are calculated for each pitch by dividing Spin Rate by Velocity.
28.6
Fastball
Total Movement Avg
The average total non-gravity movement for all pitches of this type in the given event year. Measured in inches (in).
Changeup
Velocity Avg
The average velocity for all pitches of this type in the given event year. Measured in miles per hour (MPH).
85.1
Changeup
Spin Rate Avg
The average rate of spin for all pitches of this type in the given event year. Measured in rotations per minute (RPM).
2018
Changeup
Total Movement Avg
The average total non-gravity movement for all pitches of this type in the given event year. Measured in inches (in).
Slider
Velocity Avg
The average velocity for all pitches of this type in the given event year. Measured in miles per hour (MPH).
78.3
Slider
Spin Rate Avg
The average rate of spin for all pitches of this type in the given event year. Measured in rotations per minute (RPM).
2504
Slider
Total Movement Avg
The average total non-gravity movement for all pitches of this type in the given event year. Measured in inches (in).
Fastball
Velocity Max
The maximum observed fastball velocity in the given event year. Measured in miles per hour (MPH).
90.2
Fastball
Velocity Avg
The average velocity for all pitches of this type in the given event year. Measured in miles per hour (MPH).
87.5
Fastball
Spin Rate Avg
The average rate of spin for all pitches of this type in the given event year. Measured in rotations per minute (RPM).
2219
Fastball
Spin Score Avg
The average Bauer Units value of all fastballs in the given event year. Bauer Units are calculated for each pitch by dividing Spin Rate by Velocity.
25.4
Fastball
Total Movement Avg
The average total non-gravity movement for all pitches of this type in the given event year. Measured in inches (in).
Changeup
Velocity Avg
The average velocity for all pitches of this type in the given event year. Measured in miles per hour (MPH).
72.1
Changeup
Spin Rate Avg
The average rate of spin for all pitches of this type in the given event year. Measured in rotations per minute (RPM).
1631
Changeup
Total Movement Avg
The average total non-gravity movement for all pitches of this type in the given event year. Measured in inches (in).
Slider
Velocity Avg
The average velocity for all pitches of this type in the given event year. Measured in miles per hour (MPH).
73.7
Slider
Spin Rate Avg
The average rate of spin for all pitches of this type in the given event year. Measured in rotations per minute (RPM).
2197
Slider
Total Movement Avg
The average total non-gravity movement for all pitches of this type in the given event year. Measured in inches (in).
2024 Prep Baseball All-American Game
Sep 12, 2024
Trackman - Fastball
96.4
Velocity (max)
93.1 - 95.6
Velo Range
94.5
Eff Velocity (avg)
2,848
Spin Rate (max)
2,700
Spin Rate (avg)
IVB (max)
IVB (avg)
HM (max)
HM (avg)
Extension (avg)
Release Ht (avg)
Spin Score (max)
Zone %
Trackman - Slider
82.3
Velocity (max)
75.8 - 80.7
Velo Range
78.5
Eff Velocity (avg)
2,650
Spin Rate (max)
2,504
Spin Rate (avg)
IVB (max)
IVB (avg)
HM (max)
HM (avg)
Extension (avg)
Release Ht (avg)
Spin Score (max)
Zone %
Trackman - ChangeUp
85.1
Velocity (max)
85.6
Eff Velocity (avg)
2,018
Spin Rate (max)
2,018
Spin Rate (avg)
IVB (max)
IVB (avg)
HM (max)
HM (avg)
Extension (avg)
Release Ht (avg)
Spin Score (max)
2022 PBR Future Games
Jul 27, 2022
Trackman - Fastball
90.2
Velocity (max)
87.3 - 89.4
Velo Range
88.7
Eff Velocity (avg)
2,409
Spin Rate (max)
2,218
Spin Rate (avg)
Spin Score (max)
Trackman - Slider
74.3
Velocity (max)
73.8 - 74.3
Velo Range
73.6
Eff Velocity (avg)
2,293
Spin Rate (max)
2,179
Spin Rate (avg)
Spin Score (max)
Easley Baseball Club Scout Day
Jun 2, 2022
Trackman - Fastball
85.7
Velocity (max)
83.0 - 85.3
Velo Range
84.0
Eff Velocity (avg)
2,323
Spin Rate (max)
2,220
Spin Rate (avg)
IVB (max)
IVB (avg)
HM (max)
HM (avg)
Extension (avg)
Release Ht (avg)
Spin Score (max)
Zone %
Trackman - Slider
73.9
Velocity (max)
72.3 - 73.9
Velo Range
72.2
Eff Velocity (avg)
2,266
Spin Rate (max)
2,215
Spin Rate (avg)
IVB (max)
IVB (avg)
HM (max)
HM (avg)
Extension (avg)
Release Ht (avg)
Spin Score (max)
Trackman - ChangeUp
73.9
Velocity (max)
70.8 - 73.7
Velo Range
72.4
Eff Velocity (avg)
1,651
Spin Rate (max)
1,631
Spin Rate (avg)
IVB (max)
IVB (avg)
HM (max)
HM (avg)
Extension (avg)
Release Ht (avg)
Spin Score (max)
Pitch Scores
Pitching Velos
2024
2023
2022
2021
Fastball
Velocity Max
The maximum observed fastball velocity in the given event year. Measured in miles per hour (MPH).
96.0
Fastball
Velocity Avg
The average velocity for all pitches of this type in the given event year. Measured in miles per hour (MPH)
93.0
Curveball
Velocity Avg
The average velocity for all pitches of this type in the given event year. Measured in miles per hour (MPH)
78.0
Fastball
Velocity Max
The maximum observed fastball velocity in the given event year. Measured in miles per hour (MPH).
95.0
Fastball
Velocity Avg
The average velocity for all pitches of this type in the given event year. Measured in miles per hour (MPH)
94.5
Curveball
Velocity Avg
The average velocity for all pitches of this type in the given event year. Measured in miles per hour (MPH)
79.5
Changeup
Velocity Avg
The average velocity for all pitches of this type in the given event year. Measured in miles per hour (MPH)
89.0
Fastball
Velocity Max
The maximum observed fastball velocity in the given event year. Measured in miles per hour (MPH).
89.0
Fastball
Velocity Avg
The average velocity for all pitches of this type in the given event year. Measured in miles per hour (MPH)
86.0
Curveball
Velocity Avg
The average velocity for all pitches of this type in the given event year. Measured in miles per hour (MPH)
72.5
Fastball
Velocity Max
The maximum observed fastball velocity in the given event year. Measured in miles per hour (MPH).
82.0
Fastball
Velocity Avg
The average velocity for all pitches of this type in the given event year. Measured in miles per hour (MPH)
78.6
Curveball
Velocity Avg
The average velocity for all pitches of this type in the given event year. Measured in miles per hour (MPH)
58.9
Changeup
Velocity Avg
The average velocity for all pitches of this type in the given event year. Measured in miles per hour (MPH)
69.5
Game Performance

Visual Edge

Pitch Ai

Notes
News
- Shooter's Standouts: USA 18U (Pitchers) - Jul 22, 2024
- Mississippi Scout Blog: 2024 Playoffs - May 20, 2024
- Mississippi Diamond Notes: Week 7 - Apr 3, 2024
- Mississippi Diamond Notes: Week 3 - Mar 6, 2024
- 2025 Rankings Update: 20 Picks to Click - Dec 1, 2023
- MS Most Viewed Profiles: September - Oct 4, 2023
- MS Scout Blog: Week 7 & 8 Games - Apr 9, 2023
- MS Diamond Notes: Week 7 - Apr 4, 2023
- 2025 Rankings: Risers - Sep 20, 2022
- Dirty Dozen: Future Games 2025 Arms - Sep 6, 2022
- Updated 2025 Mississippi Player Rankings - Aug 29, 2022
- PBR Future Games: Pitching Performances - Aug 1, 2022
- PBR Future Games: Game 1 Recap - Jul 28, 2022
- Easley Baseball Scout Day Recap - Jun 2, 2022
Comments
Draft Reports
Contact
Premium Content Area
To unlock contact information, you need to purchase a ScoutPLUS subscription.
Purchase Subscription OR
Login
Physical
2024
Grip Strgth (LH)
Grip strength is a measure of a players bat control and ability to transfer power and speed during impact, measured in pounds of force generated; collected with elbow bent at 90 degrees.
Grip Strgth (RH)
Grip strength is a measure of a players bat control and ability to transfer power and speed during impact, measured in pounds of force generated; collected with elbow bent at 90 degrees.


 Sign in to view rankings
Landon Harmon, East Union Attendance Center, 2025, MS
Position: RHP/OF
Body: 6-foot-3, 170-pound lengthy athletic build.
Hit: (RHH) Advanced. Started in a balanced wide stance with a tight smooth load, then used a controlled toe tap stride. Present bat speed. High finish, upward swing. Gap to gap approach.
Power: , average 81.6 mph.
Defense: (IF) Sure hands, consistent footwork, clean exchange. Projectable. (OF) Sure hands, fluid exchange. Uses his glove to the side.
Arm: 84 mph infield velocity. 89 mph outfield velocity. Long quick arm action, an-over-the-top slot, consistent accuracy.
Speed: 7.19 (60-yard).
Pitching: Advanced. Slow-tempo delivery, easy effort. Over-the-top arm angle, quick arm speed, loose arm action. Consistent balance point, even shoulders, lands square, a clean finish.
FB: (Max spin 2322; Avg 2220).
SL: (Max spin 2266; Avg 2214).