CLASS OF 2024
OF
1B
Brenson
Watters
Notre Dame
Rochester Adams (HS) • MI
 6' 2" • 213.6LBS
L/L • 18yr 8mo
Travel Team: Hit Dogs OH 2024
Rochester Adams (HS) • MI
L/L • 18yr 8mo
Travel Team: Hit Dogs OH 2024
Rankings
2024 National
Rankings available to Premium Subscriber
2024 State
Rankings available to Premium Subscriber
Commitment
Best Of Stats
23.2
Hand Speed (max)
3/05/22
84.2
Bat Speed (max)
2/04/24
20.5
Rot. Acc (max)
3/09/24
80
Hard Hit %
3/09/24
99.5
Exit Velocity (max)
3/09/24
92.7
Exit Velocity (avg)
3/09/24
374
Distance (max)
7/27/22
81
Sweet Spot %
2/04/24
6.87
60
2/04/24
-
30-yd
-
10-yd
-
Run speed (max)
90
INF Velo
2/04/24
90
OF Velo
2/04/24
-
C Velo
-
Pop Time
Fastball
73.2
Velocity (max)
2/14/21
70.2 - 72.8
Velo Range
2/14/21
1524
Spin Rate (avg)
2/14/21
Changeup
64 - 68
Velo Range
2/14/21
1406
Spin Rate (avg)
2/14/21
Slider
59 - 60
Velo Range
2/14/21
1611
Spin Rate (avg)
2/14/21
Positional Tools
2024
2022
2021
60 Yard Dash
The athlete's fastest 60-yard dash time in the given event year. Measured in seconds (s)
6.87
Infield Velocity
The athlete's maximum throwing velocity from an infield position in the given event year. Measured in miles per hour (MPH).
90.0
Outfield Velocity
The athlete's maximum throwing velocity from an outfield position in the given event year. Measured in miles per hour (MPH).
90.0
Power / Speed Score
A simple calculation that divides the athlete’s Exit Velocity Max by the athlete’s 60 Yard Dash time for the given event year. For example, 98 MPH / 7.00s = 14.00.
14.5
60 Yard Dash
The athlete's fastest 60-yard dash time in the given event year. Measured in seconds (s)
7.08
Infield Velocity
The athlete's maximum throwing velocity from an infield position in the given event year. Measured in miles per hour (MPH).
83.0
Outfield Velocity
The athlete's maximum throwing velocity from an outfield position in the given event year. Measured in miles per hour (MPH).
88.0
Power / Speed Score
A simple calculation that divides the athlete’s Exit Velocity Max by the athlete’s 60 Yard Dash time for the given event year. For example, 98 MPH / 7.00s = 14.00.
13.5
60 Yard Dash
The athlete's fastest 60-yard dash time in the given event year. Measured in seconds (s)
7.65
Home to First
The athlete's fastest home-to-first time in the given event year. Measured from bat-on-ball to foot-on-bag, in seconds (s).
4.44
Infield Velocity
The athlete's maximum throwing velocity from an infield position in the given event year. Measured in miles per hour (MPH).
78.0
Outfield Velocity
The athlete's maximum throwing velocity from an outfield position in the given event year. Measured in miles per hour (MPH).
75.0
Power / Speed Score
A simple calculation that divides the athlete’s Exit Velocity Max by the athlete’s 60 Yard Dash time for the given event year. For example, 98 MPH / 7.00s = 14.00.
11.9
Hitting

2024
2022
2021
Exit Velocity Max
The highest exit velocity of any batted ball in the given event year. Measured in miles per hour (MPH).
99.5
Exit Velocity Avg
Average exit velocity of all batted balls in the given event year. Measured in miles per hour (MPH).
91.8
Distance Max
The highest flight distance of any batted ball in the given event year. Measured in feet (ft).
357
Distance Avg
Average flight distance of all batted balls in the given event year. Measured in feet (ft).
216
Launch Angle Avg
Average launch angle of all batted balls in the given event year. Measured in degrees.
15.8
Hard Hit %
Percentage of batted balls with exit velocities over 95 MPH in the given event year.
Sweet Spot %
Percentage of batted balls in the given event year with a launch angle between 8° and 32°.
Line Drive %
Percentage of batted balls with launch angles between 10 and 25 degrees in the given event year.
Fly Ball %
Percentage of batted balls with launch angles between 25 and 50 degrees in the given event year.
Ground Ball %
Percentage of batted balls with launch angles below 10 degrees in the given event year.
Exit Velocity Max
The highest exit velocity of any batted ball in the given event year. Measured in miles per hour (MPH).
95.5
Exit Velocity Avg
Average exit velocity of all batted balls in the given event year. Measured in miles per hour (MPH).
89.9
Distance Max
The highest flight distance of any batted ball in the given event year. Measured in feet (ft).
317
Distance Avg
Average flight distance of all batted balls in the given event year. Measured in feet (ft).
159
Launch Angle Avg
Average launch angle of all batted balls in the given event year. Measured in degrees.
11.1
Hard Hit %
Percentage of batted balls with exit velocities over 95 MPH in the given event year.
Sweet Spot %
Percentage of batted balls in the given event year with a launch angle between 8° and 32°.
Line Drive %
Percentage of batted balls with launch angles between 10 and 25 degrees in the given event year.
Fly Ball %
Percentage of batted balls with launch angles between 25 and 50 degrees in the given event year.
Ground Ball %
Percentage of batted balls with launch angles below 10 degrees in the given event year.
Exit Velocity Max
The highest exit velocity of any batted ball in the given event year. Measured in miles per hour (MPH).
90.7
Exit Velocity Avg
Average exit velocity of all batted balls in the given event year. Measured in miles per hour (MPH).
83.0
Distance Max
The highest flight distance of any batted ball in the given event year. Measured in feet (ft).
318
Distance Avg
Average flight distance of all batted balls in the given event year. Measured in feet (ft).
201
Launch Angle Avg
Average launch angle of all batted balls in the given event year. Measured in degrees.
19.7
Hard Hit %
Percentage of batted balls with exit velocities over 95 MPH in the given event year.
Sweet Spot %
Percentage of batted balls in the given event year with a launch angle between 8° and 32°.
Line Drive %
Percentage of batted balls with launch angles between 10 and 25 degrees in the given event year.
Fly Ball %
Percentage of batted balls with launch angles between 25 and 50 degrees in the given event year.
Ground Ball %
Percentage of batted balls with launch angles below 10 degrees in the given event year.
2024 Michigan Preseason All-State (Invite Only)
Mar 9, 2024
Trackman - Hitting
99.5
Exit Velocity (max)
92.7
Exit Velocity (avg)
187
Distance (avg)
344
Distance (max)
Hard Hit %
Sweet Spot %
Line Drive %
Fly Ball %
Ground Ball %
Super 60 Pro Showcase
Feb 4, 2024
Trackman - Hitting
98.5
Exit Velocity (max)
90.8
Exit Velocity (avg)
247
Distance (avg)
357
Distance (max)
Hard Hit %
Sweet Spot %
Line Drive %
Fly Ball %
Ground Ball %
2022 PBR Future Games
Jul 27, 2022
Trackman - Hitting
95.8
Exit Velocity (max)
87.5
Exit Velocity (avg)
242
Distance (avg)
374
Distance (max)
Hard Hit %
Sweet Spot %
Line Drive %
Fly Ball %
Ground Ball %
2022 Michigan ProCase (Invite Only)
Mar 5, 2022
Trackman - Hitting
95.5
Exit Velocity (max)
89.9
Exit Velocity (avg)
159
Distance (avg)
317
Distance (max)
Hard Hit %
Sweet Spot %
Line Drive %
Fly Ball %
Ground Ball %
2021 Michigan Top Prospect Games (Invite Only)
Jun 22, 2021
Trackman - Hitting
90.7
Exit Velocity (max)
81.9
Exit Velocity (avg)
213
Distance (avg)
318
Distance (max)
Hard Hit %
Sweet Spot %
Line Drive %
Fly Ball %
Ground Ball %
2021 Eastern Michigan Preseason All-State (Invite Only)
Feb 14, 2021
Trackman - Hitting
89.3
Exit Velocity (max)
85.4
Exit Velocity (avg)
174
Distance (avg)
284
Distance (max)
Sweet Spot %
Line Drive %
Fly Ball %
Ground Ball %
Hitting

2024
2022
2021
Hand Speed Max
The highest Peak Hand Speed of any swing in the given event year.
23.2
Hand Speed Avg
The average Peak Hand Speed for all swings in the given event year.
20.5
Bat Speed Max
The highest Bat Speed of any swing in the given event year.
84.2
Bat Speed Avg
The average Bat Speed for all swings in the given event year.
72.1
Rotational Acceleration Max
The highest Rotational Acceleration of any swing in the given event year.
Rotational Acceleration Avg
The average Rotational Acceleration for all swings in the given event year.
On-Plane Efficiency Max
The highest On-Plane Efficiency of any swing in the given event year.
On-Plane Efficiency Avg
The average On-Plane Efficiency for all swings in the given event year.
Hand Speed Max
The highest Peak Hand Speed of any swing in the given event year.
23.2
Hand Speed Avg
The average Peak Hand Speed for all swings in the given event year.
21.5
Bat Speed Max
The highest Bat Speed of any swing in the given event year.
78.0
Bat Speed Avg
The average Bat Speed for all swings in the given event year.
69.9
Rotational Acceleration Max
The highest Rotational Acceleration of any swing in the given event year.
Rotational Acceleration Avg
The average Rotational Acceleration for all swings in the given event year.
On-Plane Efficiency Max
The highest On-Plane Efficiency of any swing in the given event year.
On-Plane Efficiency Avg
The average On-Plane Efficiency for all swings in the given event year.
Hand Speed Max
The highest Peak Hand Speed of any swing in the given event year.
22.1
Hand Speed Avg
The average Peak Hand Speed for all swings in the given event year.
21.1
Bat Speed Max
The highest Bat Speed of any swing in the given event year.
68.3
Bat Speed Avg
The average Bat Speed for all swings in the given event year.
63.7
Rotational Acceleration Max
The highest Rotational Acceleration of any swing in the given event year.
Rotational Acceleration Avg
The average Rotational Acceleration for all swings in the given event year.
On-Plane Efficiency Max
The highest On-Plane Efficiency of any swing in the given event year.
On-Plane Efficiency Avg
The average On-Plane Efficiency for all swings in the given event year.
2024 Michigan Preseason All-State (Invite Only)
Mar 9, 2024
Blast - Hitting
22.3
Hand Speed (max)
19.2
Hand Speed (avg)
77.8
Bat Speed (max)
69.6
Bat Speed (avg)
Rot. Acc (max)
Rot. Acc (avg)
On Plane Eff (avg)
MaxOnPlaneEfficiency
Super 60 Pro Showcase
Feb 4, 2024
Blast - Hitting
23.2
Hand Speed (max)
21.7
Hand Speed (avg)
84.2
Bat Speed (max)
74.4
Bat Speed (avg)
Rot. Acc (max)
Rot. Acc (avg)
On Plane Eff (avg)
MaxOnPlaneEfficiency
2022 PBR Future Games
Jul 27, 2022
Blast - Hitting
21.4
Hand Speed (max)
20.6
Hand Speed (avg)
78.0
Bat Speed (max)
73.2
Bat Speed (avg)
Rot. Acc (max)
Rot. Acc (avg)
On Plane Eff (avg)
MaxOnPlaneEfficiency
2022 Michigan ProCase (Invite Only)
Mar 5, 2022
Blast - Hitting
23.2
Hand Speed (max)
22.0
Hand Speed (avg)
71.8
Bat Speed (max)
67.9
Bat Speed (avg)
Rot. Acc (max)
Rot. Acc (avg)
On Plane Eff (avg)
MaxOnPlaneEfficiency
2021 Michigan Top Prospect Games (Invite Only)
Jun 22, 2021
Blast - Hitting
22.1
Hand Speed (max)
21.5
Hand Speed (avg)
66.5
Bat Speed (max)
62.5
Bat Speed (avg)
Rot. Acc (max)
Rot. Acc (avg)
On Plane Eff (avg)
MaxOnPlaneEfficiency
2021 Eastern Michigan Preseason All-State (Invite Only)
Feb 14, 2021
Blast - Hitting
21.7
Hand Speed (max)
20.6
Hand Speed (avg)
68.3
Bat Speed (max)
65.1
Bat Speed (avg)
Rot. Acc (max)
Rot. Acc (avg)
On Plane Eff (avg)
MaxOnPlaneEfficiency
Pitching

2021
Fastball
Velocity Max
The maximum observed fastball velocity in the given event year. Measured in miles per hour (MPH).
73.2
Fastball
Velocity Avg
The average velocity for all pitches of this type in the given event year. Measured in miles per hour (MPH).
71.5
Fastball
Spin Rate Avg
The average rate of spin for all pitches of this type in the given event year. Measured in rotations per minute (RPM).
1524
Fastball
Spin Score Avg
The average Bauer Units value of all fastballs in the given event year. Bauer Units are calculated for each pitch by dividing Spin Rate by Velocity.
21.3
Fastball
Total Movement Avg
The average total non-gravity movement for all pitches of this type in the given event year. Measured in inches (in).
Changeup
Velocity Avg
The average velocity for all pitches of this type in the given event year. Measured in miles per hour (MPH).
64.2
Changeup
Spin Rate Avg
The average rate of spin for all pitches of this type in the given event year. Measured in rotations per minute (RPM).
1406
Changeup
Total Movement Avg
The average total non-gravity movement for all pitches of this type in the given event year. Measured in inches (in).
Slider
Velocity Avg
The average velocity for all pitches of this type in the given event year. Measured in miles per hour (MPH).
59.8
Slider
Spin Rate Avg
The average rate of spin for all pitches of this type in the given event year. Measured in rotations per minute (RPM).
1611
Slider
Total Movement Avg
The average total non-gravity movement for all pitches of this type in the given event year. Measured in inches (in).
2021 Eastern Michigan Preseason All-State (Invite Only)
Feb 14, 2021
Trackman - Fastball
73.2
Velocity (max)
70.2 - 72.8
Velo Range
70.0
Eff Velocity (avg)
1,603
Spin Rate (max)
1,524
Spin Rate (avg)
IVB (max)
IVB (avg)
HM (max)
HM (avg)
Extension (avg)
Release Ht (avg)
Spin Score (max)
Zone %
Trackman - Slider
59.8
Velocity (max)
57.9
Eff Velocity (avg)
1,611
Spin Rate (max)
1,611
Spin Rate (avg)
IVB (max)
IVB (avg)
HM (max)
HM (avg)
Extension (avg)
Release Ht (avg)
Spin Score (max)
Trackman - ChangeUp
68.8
Velocity (max)
60.9 - 67.4
Velo Range
63.6
Eff Velocity (avg)
1,630
Spin Rate (max)
1,406
Spin Rate (avg)
IVB (max)
IVB (avg)
HM (max)
HM (avg)
Extension (avg)
Release Ht (avg)
Spin Score (max)
Pitch Scores
Pitching Velos
2021
Fastball
Velocity Max
The maximum observed fastball velocity in the given event year. Measured in miles per hour (MPH).
73.0
Fastball
Velocity Avg
The average velocity for all pitches of this type in the given event year. Measured in miles per hour (MPH)
71.0
Changeup
Velocity Avg
The average velocity for all pitches of this type in the given event year. Measured in miles per hour (MPH)
66.0
Slider
Velocity Avg
The average velocity for all pitches of this type in the given event year. Measured in miles per hour (MPH)
59.5
Game Performance

Visual Edge

2024
2022
Edge Score
The highest Edge Score within the given year. Edge Score is a comprehensive score that takes the core-six visual skills into account, providing an assessment of an athlete’s overall visual ability.
70.68
Edge Score
The highest Edge Score within the given year. Edge Score is a comprehensive score that takes the core-six visual skills into account, providing an assessment of an athlete’s overall visual ability.
67.41
Pitch Ai

Notes
News
- Michigan Super 60 Participants Make A Statement - Feb 13, 2024
- Super 60: Shooter's Impact 11 - Feb 6, 2024
- Watters Discovers A Great Deal To Like At Notre Dame - Sep 4, 2022
- Future Games: Shooter's Top Prospects (2024) - Aug 8, 2022
- 2022 Future Games: Heff's Hits - Aug 8, 2022
- Another Successful Future Games Completed For Team Michigan - Aug 6, 2022
- 2022 Future Games: Team Michigan - Dugout Chatter - Aug 5, 2022
- 2022 Future Games: Team Michigan - Workout/Gameday Notes - Aug 3, 2022
- 2022 Future Games: Team Michigan - Top Performers - Aug 3, 2022
- 2022 Future Games: Team Michigan - Top Statistical Performers - Aug 1, 2022
- 2022 Future Games: Team Michigan - Meet The Team - Jul 22, 2022
- Impressive Talent Highlights Michigan ProCase - Mar 14, 2022
- Results From 2022 Michigan ProCase - Mar 6, 2022
- Results From 2021 Michigan Top Prospect Games - Jun 24, 2021
- Results From 2021 Eastern Michigan Preseason All-State - Feb 15, 2021
- 2018 Scout Day: Motor City Hit Dogs - Complete Evaluations - Mar 12, 2018
- 2018 Scout Day: Motor City Hit Dogs - Top Performers - Feb 13, 2018
- Results from Michigan's 2018 Scout Day: Motor City Hit Dogs - Feb 12, 2018
Comments
Draft Reports
Contact
Premium Content Area
To unlock contact information, you need to purchase a ScoutPLUS subscription.
Purchase Subscription OR
Login
Physical
2024
Grip Strgth (LH)
Grip strength is a measure of a players bat control and ability to transfer power and speed during impact, measured in pounds of force generated; collected with elbow bent at 90 degrees.
Grip Strgth (RH)
Grip strength is a measure of a players bat control and ability to transfer power and speed during impact, measured in pounds of force generated; collected with elbow bent at 90 degrees.




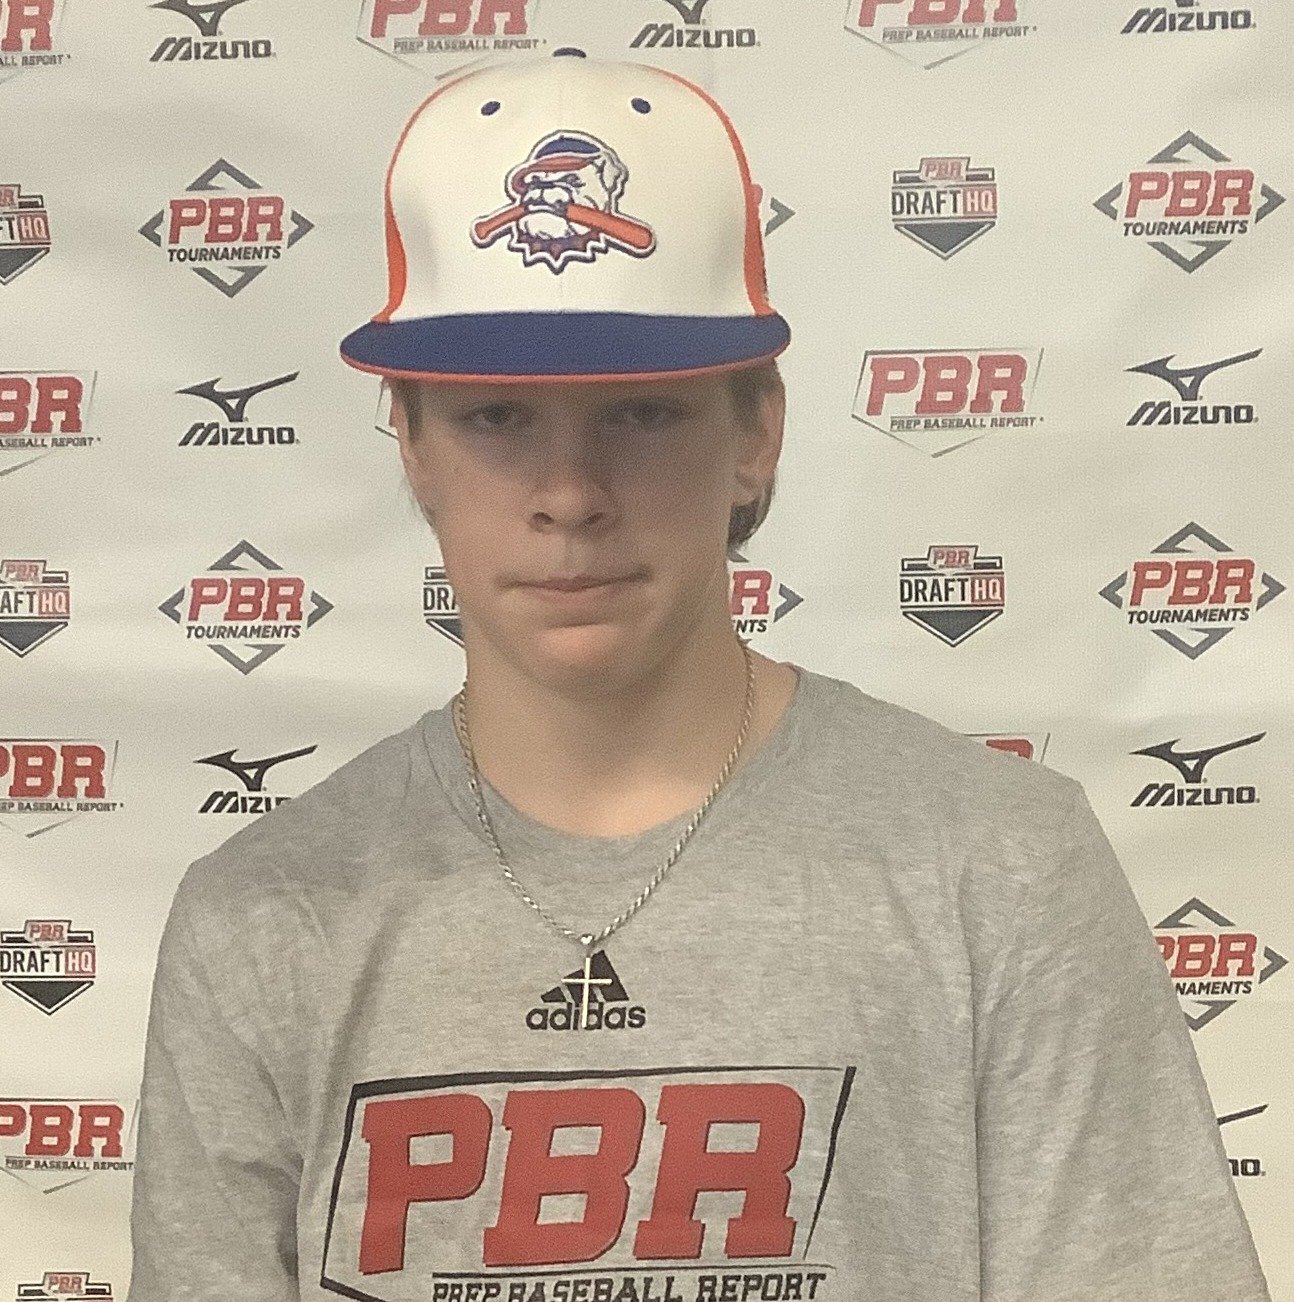




 Sign in to view rankings
Left handed hitter crushed the ball during BP. Consistent barrels with loud contact. Ball jumps off the bat working pullside during BP. 7.08 runner who plays faster on bases during game. Primary 1B with the atleticism and arm to play corner OF.
Brenson Watters: 1B/OF, (2024) Rochester Adams, MI. 6-foot-1, 185-pound. Projectable smooth during batting practice, Watters recorded an exit velocity of 95 mph. (67.9 mph bat speed average). (22.0 mph hand speed average). Started in an athletic active stance with a big smooth load, then used a leg kick. Found multiple barrels with loud contact. Solid in the infield, displayed a velocity of 83 mph; has a quick exchange, smooth feet, and sure hands. Solid when throwing from the outfield, he showed off his strong arm with throws at velocities of 88 mph;shows developing consistent feet, firm hands, and a clean exchange. Fielded the ball out front with raw average movement laterally. (Max spin ; Avg ).
Brenson Watters: 1B/LHP, (2024) Rochester Adams, MI. 5-foot-11, 165-pound. At the plate, the left-handed hitter clocked an exit velocity of 91 mph. (62.53 mph bat speed average). (21.51 mph hand speed average). Setup is comprised of an open tall stance and a small leg kick. Flat swing plane. Pull side approach. From the outfield, he showed the ability to throw at velocities up to 75 mph. Capable while in the infield, recorded position velocities up to 76 mph; had a natural exchange, and consistent hands. Uses his glove out front. Clocked a time of 7.65 in the 60-yard dash. (Max spin ; Avg ).
Scout Evaluation
Brenson Watters, Rochester Adams, 2024, MI
Position: 1B/LHP
Body: 5-foot-11, 165-pound.
Hit: (LHH) Setup is comprised of an open tall stance and a small leg kick. Pull side approach.
Power: 91 mph exit velocity, average 81.93 mph. 62.53 mph bat speed average. 21.51 mph hand speed average.
Defense: (IF) Consistent hands, natural exchange. Capable. Glovework was used out front.
Arm: 76 mph infield velocity. 75 mph outfield velocity.
Speed: 7.65 (60-yard).
Brenson Watters: 1B/LHP, (2024) Rochester Adams, MI. 5-foot-11, 165-pound. During batting practice, the left-handed hitter clocked an exit velocity of 88 mph. In the infield, his best throw was recorded at 78 mph. On the mound, used a high ¾ arm angle with a consistent arm action while showing some arm speed. Used some effort in his delivery. Showed falling off shoulders. Lands closed with a falling off finish. Changeup (64-68 mph).Produced a fastball that came in at 70-72 mph and topped out at 73 mph; had cutting action and arm side command. Had late action on his 2/8 slider (59-60).
Scout Evaluation
Brenson Watters, Rochester Adams, 2024, MI
Position: 1B/LHP
Body: 5-foot-11, 165-pound .
Power: 88 mph exit velocity, average 85.36 mph. 65.10 mph bat speed average. 20.56 mph hand speed average.
Arm: 78 mph infield velocity.
Pitching: Some effort. High ¾ arm angle, some arm speed, consistent arm action. Falling off shoulders, lands closed, a falling off finish.
FB: T73. 70-72 mph. (Max spin 1603; Avg 1523). Arm side accuracy, cutting action.
CH: 64-68 mph.
SL: 59-60 mph. Late action, 2/8 shape.