CLASS OF 2021
SS
2B
Ehinger
Adrianza
Harper JC
Felix Varela Senior (HS) • FL
5' 9" • 155LBS
L/R • 21yr
Felix Varela Senior (HS) • FL
5' 9" • 155LBS
L/R • 21yr
Rankings
2021 National
Rankings available to Premium Subscriber
2021 State
Rankings available to Premium Subscriber
Commitment
Best Of Stats
22.8
Hand Speed (max)
9/22/21
75.7
Bat Speed (max)
10/03/22
14.8
Rot. Acc (max)
9/22/21
42
Hard Hit %
10/03/22
94.9
Exit Velocity (max)
10/03/22
88
Exit Velocity (avg)
10/03/22
341
Distance (max)
10/03/22
60
Sweet Spot %
9/22/21
6.83
60
10/03/22
-
30-yd
-
10-yd
-
Run speed (max)
86
INF Velo
10/03/22
-
OF Velo
-
C Velo
-
Pop Time
Positional Tools
2022
2021
60 Yard Dash
The athlete's fastest 60-yard dash time in the given event year. Measured in seconds (s)
6.83
Infield Velocity
The athlete's maximum throwing velocity from an infield position in the given event year. Measured in miles per hour (MPH).
86.0
Power / Speed Score
A simple calculation that divides the athlete’s Exit Velocity Max by the athlete’s 60 Yard Dash time for the given event year. For example, 98 MPH / 7.00s = 14.00.
13.9
60 Yard Dash
The athlete's fastest 60-yard dash time in the given event year. Measured in seconds (s)
7.05
Infield Velocity
The athlete's maximum throwing velocity from an infield position in the given event year. Measured in miles per hour (MPH).
85.0
Power / Speed Score
A simple calculation that divides the athlete’s Exit Velocity Max by the athlete’s 60 Yard Dash time for the given event year. For example, 98 MPH / 7.00s = 14.00.
13.1
Hitting

2022
2021
Exit Velocity Max
The highest exit velocity of any batted ball in the given event year. Measured in miles per hour (MPH).
94.9
Exit Velocity Avg
Average exit velocity of all batted balls in the given event year. Measured in miles per hour (MPH).
88.0
Distance Max
The highest flight distance of any batted ball in the given event year. Measured in feet (ft).
341
Distance Avg
Average flight distance of all batted balls in the given event year. Measured in feet (ft).
175
Launch Angle Avg
Average launch angle of all batted balls in the given event year. Measured in degrees.
16.3
Hard Hit %
Percentage of batted balls with exit velocities over 95 MPH in the given event year.
Sweet Spot %
Percentage of batted balls in the given event year with a launch angle between 8° and 32°.
Line Drive %
Percentage of batted balls with launch angles between 10 and 25 degrees in the given event year.
Fly Ball %
Percentage of batted balls with launch angles between 25 and 50 degrees in the given event year.
Ground Ball %
Percentage of batted balls with launch angles below 10 degrees in the given event year.
Exit Velocity Max
The highest exit velocity of any batted ball in the given event year. Measured in miles per hour (MPH).
92.2
Exit Velocity Avg
Average exit velocity of all batted balls in the given event year. Measured in miles per hour (MPH).
85.1
Distance Max
The highest flight distance of any batted ball in the given event year. Measured in feet (ft).
330
Distance Avg
Average flight distance of all batted balls in the given event year. Measured in feet (ft).
199
Launch Angle Avg
Average launch angle of all batted balls in the given event year. Measured in degrees.
17.0
Hard Hit %
Percentage of batted balls with exit velocities over 95 MPH in the given event year.
Sweet Spot %
Percentage of batted balls in the given event year with a launch angle between 8° and 32°.
Line Drive %
Percentage of batted balls with launch angles between 10 and 25 degrees in the given event year.
Fly Ball %
Percentage of batted balls with launch angles between 25 and 50 degrees in the given event year.
Ground Ball %
Percentage of batted balls with launch angles below 10 degrees in the given event year.
PBR IL: Harper JC Scout Day
Oct 3, 2022
Trackman - Hitting
94.9
Exit Velocity (max)
88.0
Exit Velocity (avg)
175
Distance (avg)
341
Distance (max)
Hard Hit %
Sweet Spot %
Line Drive %
Fly Ball %
Ground Ball %
PBR IL: Harper JC Scout Day
Sep 22, 2021
Trackman - Hitting
92.2
Exit Velocity (max)
85.1
Exit Velocity (avg)
199
Distance (avg)
330
Distance (max)
Hard Hit %
Sweet Spot %
Line Drive %
Fly Ball %
Ground Ball %
Hitting

2022
2021
Hand Speed Max
The highest Peak Hand Speed of any swing in the given event year.
22.2
Hand Speed Avg
The average Peak Hand Speed for all swings in the given event year.
21.0
Bat Speed Max
The highest Bat Speed of any swing in the given event year.
75.7
Bat Speed Avg
The average Bat Speed for all swings in the given event year.
72.0
Rotational Acceleration Max
The highest Rotational Acceleration of any swing in the given event year.
Rotational Acceleration Avg
The average Rotational Acceleration for all swings in the given event year.
On-Plane Efficiency Max
The highest On-Plane Efficiency of any swing in the given event year.
On-Plane Efficiency Avg
The average On-Plane Efficiency for all swings in the given event year.
Hand Speed Max
The highest Peak Hand Speed of any swing in the given event year.
22.8
Hand Speed Avg
The average Peak Hand Speed for all swings in the given event year.
21.1
Bat Speed Max
The highest Bat Speed of any swing in the given event year.
74.4
Bat Speed Avg
The average Bat Speed for all swings in the given event year.
71.5
Rotational Acceleration Max
The highest Rotational Acceleration of any swing in the given event year.
Rotational Acceleration Avg
The average Rotational Acceleration for all swings in the given event year.
On-Plane Efficiency Max
The highest On-Plane Efficiency of any swing in the given event year.
On-Plane Efficiency Avg
The average On-Plane Efficiency for all swings in the given event year.
PBR IL: Harper JC Scout Day
Oct 3, 2022
Blast - Hitting
22.2
Hand Speed (max)
21.0
Hand Speed (avg)
75.7
Bat Speed (max)
72.0
Bat Speed (avg)
Rot. Acc (max)
Rot. Acc (avg)
On Plane Eff (avg)
MaxOnPlaneEfficiency
PBR IL: Harper JC Scout Day
Sep 22, 2021
Blast - Hitting
22.8
Hand Speed (max)
21.1
Hand Speed (avg)
74.4
Bat Speed (max)
71.5
Bat Speed (avg)
Rot. Acc (max)
Rot. Acc (avg)
On Plane Eff (avg)
Pitching

Pitch Scores
Pitching Velos
Game Performance

Visual Edge

Pitch Ai

Notes
News
Comments
Draft Reports
Contact
Premium Content Area
To unlock contact information, you need to purchase a ScoutPLUS subscription.
Purchase Subscription OR
Login


 Sign in to view rankings
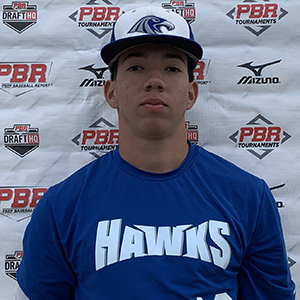
True Sophomore. Adrianza looks to be one of the top returning players for the Hawks this season, coming off Second Team All-Conference and Second Team All-Region selections from last year. He led the team in batting average last season, cruising to a .369 clip in 168 at-bats with 13 doubles, 37 RBIs and 25 runs scored. The left-handed hitter has a compact and easy swing, remaining fluid throughout the operation while consistently producing line-drives (94.9 max EV). His 6.83 60-time compliments his approach at the plate as well as his defensive capabilities; cruising the infield with a range to both sides and a bounce to his step - also pairing with athletic/clean actions. His arm is plenty strong to remain at shortstop moving forward, reaching up to 86 mph across the diamond. Adrianza’s defense alone should make him a name to know for colleges looking to add an above-average defender to their lineup, but his left-handed bat with battle-tested success should come as an added bonus.