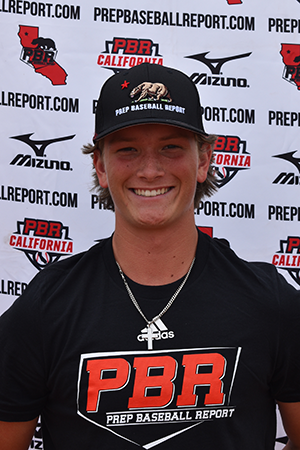
CLASS OF 2026
C
Warren
Gravely IV
Santa Margarita Catholic (HS) • CA
 5' 11" • 193.3LBS
R/R • 17yr 3mo
Travel Team: Alpha Prime '26
R/R • 17yr 3mo
Travel Team: Alpha Prime '26
Rankings
2026 National
Rankings available to Premium Subscriber
2026 State
Rankings available to Premium Subscriber
Commitment
Best Of Stats
23.7
Hand Speed (max)
6/06/23
79.4
Bat Speed (max)
6/06/23
12.1
Rot. Acc (max)
1/29/23
78
Hard Hit %
7/24/24
98.1
Exit Velocity (max)
7/24/24
92
Exit Velocity (avg)
7/24/24
352
Distance (max)
7/24/24
100
Sweet Spot %
7/24/24
7.44
60
9/11/22
4.14
30-yd
6/01/24
1.81
10-yd
6/01/24
18.4
Run speed (max)
6/01/24
90
INF Velo
1/29/23
90
OF Velo
6/01/24
82
C Velo
6/01/24
1.94 - 2.02
Pop Time
6/01/24
Fastball
87.4
Velocity (max)
6/06/23
85.1 - 86.9
Velo Range
6/06/23
2101
Spin Rate (avg)
6/06/23
Changeup
78 - 79
Velo Range
6/13/23
1576
Spin Rate (avg)
6/06/23
Curveball
73.9 - 75.9
Velo Range
6/06/23
2070
Spin Rate (avg)
6/06/23
Slider
75 - 76
Velo Range
6/13/23
-
Spin Rate (avg)
Positional Tools
2024
2023
2022
Pop Time
The athlete's fastest pop time in the given event year. Measured from glove to glove, in seconds (s).
1.94 - 2.10
Catcher Velocity
The athlete's maximum throwing velocity from the catcher position in the given event year. Measured in miles per hour (MPH).
82.0
Outfield Velocity
The athlete's maximum throwing velocity from an outfield position in the given event year. Measured in miles per hour (MPH).
90.0
60 Yard Dash
The athlete's fastest 60-yard dash time in the given event year. Measured in seconds (s)
7.94
Pop Time
The athlete's fastest pop time in the given event year. Measured from glove to glove, in seconds (s).
1.94 - 2.15
Catcher Velocity
The athlete's maximum throwing velocity from the catcher position in the given event year. Measured in miles per hour (MPH).
79.0
Infield Velocity
The athlete's maximum throwing velocity from an infield position in the given event year. Measured in miles per hour (MPH).
90.0
Power / Speed Score
A simple calculation that divides the athlete’s Exit Velocity Max by the athlete’s 60 Yard Dash time for the given event year. For example, 98 MPH / 7.00s = 14.00.
11.8
60 Yard Dash
The athlete's fastest 60-yard dash time in the given event year. Measured in seconds (s)
7.44
Pop Time
The athlete's fastest pop time in the given event year. Measured from glove to glove, in seconds (s).
2.01 - 2.03
Catcher Velocity
The athlete's maximum throwing velocity from the catcher position in the given event year. Measured in miles per hour (MPH).
78.0
Infield Velocity
The athlete's maximum throwing velocity from an infield position in the given event year. Measured in miles per hour (MPH).
87.0
Power / Speed Score
A simple calculation that divides the athlete’s Exit Velocity Max by the athlete’s 60 Yard Dash time for the given event year. For example, 98 MPH / 7.00s = 14.00.
11.9
Hitting

2024
2023
2022
Exit Velocity Max
The highest exit velocity of any batted ball in the given event year. Measured in miles per hour (MPH).
98.1
Exit Velocity Avg
Average exit velocity of all batted balls in the given event year. Measured in miles per hour (MPH).
89.6
Distance Max
The highest flight distance of any batted ball in the given event year. Measured in feet (ft).
352
Distance Avg
Average flight distance of all batted balls in the given event year. Measured in feet (ft).
290
Launch Angle Avg
Average launch angle of all batted balls in the given event year. Measured in degrees.
21.9
Hard Hit %
Percentage of batted balls with exit velocities over 95 MPH in the given event year.
Sweet Spot %
Percentage of batted balls in the given event year with a launch angle between 8° and 32°.
Line Drive %
Percentage of batted balls with launch angles between 10 and 25 degrees in the given event year.
Fly Ball %
Percentage of batted balls with launch angles between 25 and 50 degrees in the given event year.
Ground Ball %
Percentage of batted balls with launch angles below 10 degrees in the given event year.
Exit Velocity Max
The highest exit velocity of any batted ball in the given event year. Measured in miles per hour (MPH).
93.8
Exit Velocity Avg
Average exit velocity of all batted balls in the given event year. Measured in miles per hour (MPH).
87.1
Distance Max
The highest flight distance of any batted ball in the given event year. Measured in feet (ft).
307
Distance Avg
Average flight distance of all batted balls in the given event year. Measured in feet (ft).
218
Launch Angle Avg
Average launch angle of all batted balls in the given event year. Measured in degrees.
16.3
Hard Hit %
Percentage of batted balls with exit velocities over 95 MPH in the given event year.
Sweet Spot %
Percentage of batted balls in the given event year with a launch angle between 8° and 32°.
Line Drive %
Percentage of batted balls with launch angles between 10 and 25 degrees in the given event year.
Fly Ball %
Percentage of batted balls with launch angles between 25 and 50 degrees in the given event year.
Ground Ball %
Percentage of batted balls with launch angles below 10 degrees in the given event year.
Exit Velocity Max
The highest exit velocity of any batted ball in the given event year. Measured in miles per hour (MPH).
88.3
Exit Velocity Avg
Average exit velocity of all batted balls in the given event year. Measured in miles per hour (MPH).
81.0
Distance Max
The highest flight distance of any batted ball in the given event year. Measured in feet (ft).
327
Distance Avg
Average flight distance of all batted balls in the given event year. Measured in feet (ft).
186
Launch Angle Avg
Average launch angle of all batted balls in the given event year. Measured in degrees.
16.0
Hard Hit %
Percentage of batted balls with exit velocities over 95 MPH in the given event year.
Sweet Spot %
Percentage of batted balls in the given event year with a launch angle between 8° and 32°.
Line Drive %
Percentage of batted balls with launch angles between 10 and 25 degrees in the given event year.
Fly Ball %
Percentage of batted balls with launch angles between 25 and 50 degrees in the given event year.
Ground Ball %
Percentage of batted balls with launch angles below 10 degrees in the given event year.
Future Games (Class of 2026/27)
Jul 24, 2024
Trackman - Hitting
98.1
Exit Velocity (max)
92.0
Exit Velocity (avg)
303
Distance (avg)
352
Distance (max)
Hard Hit %
Sweet Spot %
Line Drive %
FUTURE GAMES TRYOUT: Orange County
Jun 1, 2024
Trackman - Hitting
97.5
Exit Velocity (max)
87.2
Exit Velocity (avg)
278
Distance (avg)
338
Distance (max)
Hard Hit %
Sweet Spot %
Line Drive %
Fly Ball %
Ground Ball %
FUTURE GAMES TRYOUT: NorCal
Jun 6, 2023
Trackman - Hitting
93.8
Exit Velocity (max)
86.2
Exit Velocity (avg)
219
Distance (avg)
305
Distance (max)
Hard Hit %
Sweet Spot %
Line Drive %
Fly Ball %
Ground Ball %
South Bay Preseason ID
Jan 29, 2023
Trackman - Hitting
91.7
Exit Velocity (max)
88.0
Exit Velocity (avg)
216
Distance (avg)
307
Distance (max)
Hard Hit %
Sweet Spot %
Line Drive %
Ground Ball %
NorCal Rising Stars Game
Sep 11, 2022
Trackman - Hitting
88.3
Exit Velocity (max)
81.0
Exit Velocity (avg)
186
Distance (avg)
327
Distance (max)
Sweet Spot %
Line Drive %
Fly Ball %
Ground Ball %
Hitting

2024
2023
Hand Speed Max
The highest Peak Hand Speed of any swing in the given event year.
22.7
Hand Speed Avg
The average Peak Hand Speed for all swings in the given event year.
20.1
Bat Speed Max
The highest Bat Speed of any swing in the given event year.
75.2
Bat Speed Avg
The average Bat Speed for all swings in the given event year.
68.9
Rotational Acceleration Max
The highest Rotational Acceleration of any swing in the given event year.
Rotational Acceleration Avg
The average Rotational Acceleration for all swings in the given event year.
On-Plane Efficiency Max
The highest On-Plane Efficiency of any swing in the given event year.
On-Plane Efficiency Avg
The average On-Plane Efficiency for all swings in the given event year.
Hand Speed Max
The highest Peak Hand Speed of any swing in the given event year.
23.7
Hand Speed Avg
The average Peak Hand Speed for all swings in the given event year.
20.7
Bat Speed Max
The highest Bat Speed of any swing in the given event year.
79.4
Bat Speed Avg
The average Bat Speed for all swings in the given event year.
67.3
Rotational Acceleration Max
The highest Rotational Acceleration of any swing in the given event year.
Rotational Acceleration Avg
The average Rotational Acceleration for all swings in the given event year.
On-Plane Efficiency Max
The highest On-Plane Efficiency of any swing in the given event year.
On-Plane Efficiency Avg
The average On-Plane Efficiency for all swings in the given event year.
Future Games (Class of 2026/27)
Jul 24, 2024
Blast - Hitting
22.7
Hand Speed (max)
21.0
Hand Speed (avg)
75.2
Bat Speed (max)
71.1
Bat Speed (avg)
Rot. Acc (max)
Rot. Acc (avg)
On Plane Eff (avg)
MaxOnPlaneEfficiency
FUTURE GAMES TRYOUT: Orange County
Jun 1, 2024
Blast - Hitting
19.9
Hand Speed (max)
19.0
Hand Speed (avg)
68.1
Bat Speed (max)
66.3
Bat Speed (avg)
Rot. Acc (max)
Rot. Acc (avg)
On Plane Eff (avg)
MaxOnPlaneEfficiency
FUTURE GAMES TRYOUT: NorCal
Jun 6, 2023
Blast - Hitting
23.7
Hand Speed (max)
21.6
Hand Speed (avg)
79.4
Bat Speed (max)
71.6
Bat Speed (avg)
Rot. Acc (max)
Rot. Acc (avg)
On Plane Eff (avg)
MaxOnPlaneEfficiency
South Bay Preseason ID
Jan 29, 2023
Blast - Hitting
20.6
Hand Speed (max)
19.7
Hand Speed (avg)
66.2
Bat Speed (max)
62.9
Bat Speed (avg)
Rot. Acc (max)
Rot. Acc (avg)
On Plane Eff (avg)
MaxOnPlaneEfficiency
Pitching

2023
Fastball
Velocity Max
The maximum observed fastball velocity in the given event year. Measured in miles per hour (MPH).
87.4
Fastball
Velocity Avg
The average velocity for all pitches of this type in the given event year. Measured in miles per hour (MPH).
86.0
Fastball
Spin Rate Avg
The average rate of spin for all pitches of this type in the given event year. Measured in rotations per minute (RPM).
2101
Fastball
Spin Score Avg
The average Bauer Units value of all fastballs in the given event year. Bauer Units are calculated for each pitch by dividing Spin Rate by Velocity.
24.4
Fastball
Total Movement Avg
The average total non-gravity movement for all pitches of this type in the given event year. Measured in inches (in).
Curveball
Velocity Avg
The average velocity for all pitches of this type in the given event year. Measured in miles per hour (MPH).
74.9
Curveball
Spin Rate Avg
The average rate of spin for all pitches of this type in the given event year. Measured in rotations per minute (RPM).
2070
Curveball
Total Movement Avg
The average total non-gravity movement for all pitches of this type in the given event year. Measured in inches (in).
Changeup
Velocity Avg
The average velocity for all pitches of this type in the given event year. Measured in miles per hour (MPH).
79.6
Changeup
Spin Rate Avg
The average rate of spin for all pitches of this type in the given event year. Measured in rotations per minute (RPM).
1576
Changeup
Total Movement Avg
The average total non-gravity movement for all pitches of this type in the given event year. Measured in inches (in).
FUTURE GAMES TRYOUT: NorCal
Jun 6, 2023
Trackman - Fastball
87.4
Velocity (max)
85.1 - 86.9
Velo Range
84.8
Eff Velocity (avg)
2,207
Spin Rate (max)
2,101
Spin Rate (avg)
IVB (max)
IVB (avg)
HM (max)
HM (avg)
Extension (avg)
Release Ht (avg)
Spin Score (max)
Zone %
Spin Efficiency % (avg)
Trackman - Curveball
76.4
Velocity (max)
73.9 - 75.9
Velo Range
73.1
Eff Velocity (avg)
2,218
Spin Rate (max)
2,070
Spin Rate (avg)
IVB (max)
IVB (avg)
HM (max)
HM (avg)
Extension (avg)
Release Ht (avg)
Spin Score (max)
Zone %
Spin Efficiency % (avg)
Trackman - ChangeUp
79.6
Velocity (max)
79.5
Eff Velocity (avg)
1,576
Spin Rate (max)
1,576
Spin Rate (avg)
IVB (max)
IVB (avg)
HM (max)
HM (avg)
Extension (avg)
Release Ht (avg)
Spin Score (max)
Spin Efficiency % (avg)
Pitch Scores
2023
Fastball
Hop+
A fastball with hop has a flat approach angle and visually jumps through the zone. When thrown up in the zone, it is more likely to generate a higher swing and miss average. Hop+ of 100 is MLB average.
Fastball
Sink+
A fastball with sink has low backspin and drops through the strike zone. When thrown down in the zone, it is more likely to generate a higher ground ball percentage and lower launch angle. Sink+ of 100 is MLB average.
Fastball
Rise+
A fastball with rise has a high percentage of backspin. When thrown up in the zone, it is more likely to generate a higher fly ball percentage. Rise+ of 100 is MLB average
Curveball
Hammer+
A hammer breaking ball drops vertically with velocity through the zone, or 12-to-6 movement. Hammer+ of 100 is MLB average.
Curveball
Sweep+
A sweeping breaking ball moves horizontally with velocity through the zone. Sweep+ of 100 is MLB average.
Pitching Velos
2023
Fastball
Velocity Max
The maximum observed fastball velocity in the given event year. Measured in miles per hour (MPH).
86.0
Fastball
Velocity Avg
The average velocity for all pitches of this type in the given event year. Measured in miles per hour (MPH)
85.5
Changeup
Velocity Avg
The average velocity for all pitches of this type in the given event year. Measured in miles per hour (MPH)
78.5
Slider
Velocity Avg
The average velocity for all pitches of this type in the given event year. Measured in miles per hour (MPH)
75.5
Game Performance

2024
2023
10 Yard Dash
The athlete's fastest 0-10-yard split time in the given event year. Measured in seconds.
1.81
30 Yard Dash
The athlete's fastest 0-30-yard split time in the given event year. Measured in seconds.
4.14
60 Yard Dash
The athlete's fastest 0-60-yard time in the given event year. Measured in seconds.
7.48
Top Speed (MPH)
The athlete's fastest split time converted to miles per hour.
RSi
The reactive strength index measurement of an athlete's explosiveness by comparing their jump height to the ground contact time in between their jumps. On a scale of 0-5.
Vertical Jump
A measure of any athlete's body strength and reach calculated from the flight time divided by the contact time.
FUTURE GAMES TRYOUT: Orange County
Jun 1, 2024
Swift
1.81
10-yd
4.14
30-yd
7.48
60-yd
18.4
Run speed (max)
2.03
RSi (max)
28.0
Jump Height (max)
South Bay Preseason ID
Jan 29, 2023
Swift
17.1
Run speed (max)
2.46
RSi (max)
2.46
RSi (avg)
1,409
Jump Power (max)
25.0
Jump Height (max)
24.8
Jump Height (avg)
Visual Edge

2024
Edge Score
The highest Edge Score within the given year. Edge Score is a comprehensive score that takes the core-six visual skills into account, providing an assessment of an athlete’s overall visual ability.
66.52
Pitch Ai

Notes
News
- Future Games Spotlight: '26 C/OF Warren Gravely IV - Sep 24, 2024
- Prep Baseball Future Games Team California Game Recap - Jul 25, 2024
- RANKINGS UPDATE: Class of 2026 - Sep 5, 2023
- South Bay Preseason ID: TrackMan Hitting Data - Feb 2, 2023
- South Bay Preseason ID: Swift Athletic Testing - Feb 2, 2023
- South Bay Preseason ID: Blast Motion Leaders - Feb 1, 2023
- South Bay Preseason ID: Stats Leaders - Jan 31, 2023
- 2023 Team Preview: Valley Christian Warriors - Jan 27, 2023
- 2023 Preseason ID Events: Who's Coming? - Dec 27, 2022
- 2026 State Player Rankings - Nov 16, 2022
- NorCal Rising Stars Game: Speed & Fielding Stats - Sep 16, 2022
- NorCal Rising Stars Game: Trackman Hitting Leaderboard - Sep 14, 2022
- NorCal Rising Stars Game: Quick Hits - Sep 13, 2022
Comments
Draft Reports
Contact
Premium Content Area
To unlock contact information, you need to purchase a ScoutPLUS subscription.
Purchase Subscription OR
Login
Physical
2024
Grip Strgth (LH)
Grip strength is a measure of a players bat control and ability to transfer power and speed during impact, measured in pounds of force generated; collected with elbow bent at 90 degrees.
Grip Strgth (RH)
Grip strength is a measure of a players bat control and ability to transfer power and speed during impact, measured in pounds of force generated; collected with elbow bent at 90 degrees.


 Sign in to view rankings
Warren Gravely IV, Santa Margarita Catholic (CA), 2026
Positional Profile: C RH hitting C/OF who shows offensive impact and strength with quality defensive profile
Body: 5-11, 193-pounds. Strong frame with present strength to upper and lower body
Hit: RHH. Slightly open stance with bend in his knees with slight hinge of the hips. Back elbow high even with his rear shoulder hands are slighlty off the body about shoulder height with barrel tipped forward. Medium leg kick in the load with a forward move to a wider base that allows him to sink down into his back leg and create tilt in his body that plays to his middle/pull approach looking to get the baseball in the air. Present bat speed with an uphill path that generates fly ball/line drive contact off the barrel consistently. Finishes both with 1 and 2 hands through the baseball.
Power: Shows feel to consistently get the barrel on the baseball with authority while producing a 94% Fly ball/Line drive rate including EVs up to 98 while averaging 89.6 MPH with current pull side HR power that can potentially play to middle of the diamond to oppo HR power.
Arm: RH. C-78 mph. Present arm strength with ability to carry the throw. Slot and transfer can be inconsistent at times altering release point but shows average to fringe above average potential.
Defense: 2.02-2.10 pop times. Solid receiver who has strength in his wrist while displaying mobility in lower half. Blocking flashes potential.
Positional Profile: C/RHP Gravely had an outstanding year in his debut season in the Trinity League. Serving as primarily the DH, he showed a strong ability behind the dish to stick there.
Body: 6-0, 185-pounds. Strong build with tons of strength in the lower half. Filled out well in the past year.
Hit: RHH. Feet slightly past shoulder width, rhythmic movement pre-pitch. Legs are fully engaged. Quick and powerful stroke. Gets good lift. Uses whole body well, gap to gap power with the ability to easily leave the yard.
Power: 97 max exit velocity, averaged 87.2 mph. 338' max distance.
Arm: RH. C-82 mph. OF-90 mph. Electric arm both behind the plate and in the OF. Zippy AA with online throws.
Defense: 1.94-2.02 pop times. Moves really well behind the plate, ball gets out quick and online. In OF, moves around the ball with good positioning.
ATH: 7.48 runner in the 60. 1.81 and 4.14 in the 10 and 30 yard splits. 28.00 max vertical.
Event: Future Games Tryout: NorCal
Positional Profile: C/RHP
Physical: 6-0, 180-pounds; Well built frame; 7.31 60-yard, 4.00 30-yard, 1.69 10-yard
Offensively: RH. EV max – 93.8 mph, hand speed max – 23.7 mph, bat speed max – 79.4 mph; Open stance with loose, lively hands. Big leg kick as a timing mechanism. Aggressive approach to the pullside.
Defensively: C Velo - 79 mph; Pop Time 1.94-2.04; Clean transfer behind the dish while allowing the ball to travel. Blocked agilely and worked through the bottom of the ball while receiving.
Delivery: High leg-kick with a slight pause at the top of his motion. Works forward in a line while hiding his release effectively. Finishes facing the first base size with his back leg in the air.
Arm Action: 3/4 release. Has a clean arm path.
FB: T87.4 mph, 85.1 - 86.9 mph range, 2101 avg spin; Lively and explosive that dominates the top of the zone with a little armside run.
CB:73.9 - 75.9 mph, 2070 avg spin; Very sharp break (11/5).
CHG: 78.0 - 79.0 mph, 1576 avg spin; Works well off of his fastball. Dives away from left handed hitters.
Event: South Bay Preseason ID
Positional Profile: C/3B
Physical: 5-11, 170-pounds; 7.44 60-yard (previous event), 25.0” max jump height; Broad through shoulders, long legs on otherwise average size body, has look of a player who still has at least one more growth spurt in the future.
Offensively: RH. EV max – 91.7 mph, hand speed max – 20.6 mph, bat speed max – 66.2 mph; Deep in box, open stance, wider feet, smaller load straight back, fairly sizeable reverse knee lift to backside before getting out to longer stride, slides hips into a crash at contact approach, raw stroke with flat swing plane and ability to make impact contact, flashes impact swings when balanced, as he refines the approach and mechanics he will continue to develop into a significant hitting talent.
Defensively: 3B – 90, C – 79 mph, pops – 1.94-2.04; Arm talent is special, primary catcher with everyday ability as a 3B as well, ball leaps out of his hand at both positions, accurate more often than not even with full intent to let it live, as catcher understands how to quickly get to catcher throwing mechanics, can receive in all the various set-ups, works below the ball, at 3B works low to and through ball, sets up to get throws off quickly, soft hands, full range of talents and he’s still gaining skill and nuance.