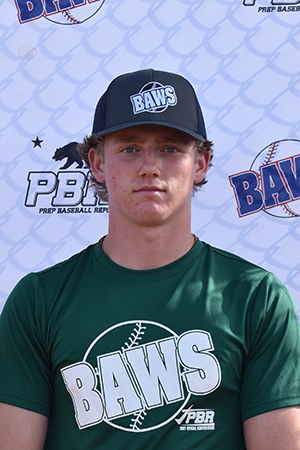
CLASS OF 2024
RHP
Miles
Tenscher
California
Vintage (HS) • CA
6' 1" • 190LBS
R/R • 18yr 10mo
Travel Team: Zoots
Vintage (HS) • CA
6' 1" • 190LBS
R/R • 18yr 10mo
Travel Team: Zoots
Rankings
2024 National
Rankings available to Premium Subscriber
2024 State
Rankings available to Premium Subscriber
Commitment
Best Of Stats
Fastball
88.5
Velocity (max)
6/09/23
85.1 - 87.1
Velo Range
6/09/23
1865
Spin Rate (avg)
6/09/23
Changeup
76.6 - 77.6
Velo Range
6/09/23
1139
Spin Rate (avg)
6/09/23
Curveball
59.7 - 64.8
Velo Range
9/18/21
1848
Spin Rate (avg)
9/18/21
Slider
71.3 - 74.3
Velo Range
6/04/23
2337
Spin Rate (avg)
6/09/23
86.9
Exit Velocity (max)
9/18/21
77
Exit Velocity (avg)
9/18/21
273
Distance (max)
9/18/21
36
Sweet Spot %
9/18/21
22.6
Hand Speed (max)
9/18/21
67
Bat Speed (max)
9/18/21
18.5
Rot. Acc (max)
9/18/21
-
Hard Hit %
7.69
60
9/18/21
-
30-yd
-
10-yd
-
Run speed (max)
-
INF Velo
-
OF Velo
76
C Velo
9/18/21
2.05 - 2.15
Pop Time
9/18/21
Positional Tools
2021
60 Yard Dash
The athlete's fastest 60-yard dash time in the given event year. Measured in seconds (s)
7.69
Pop Time
The athlete's fastest pop time in the given event year. Measured from glove to glove, in seconds (s).
2.05 - 2.15
Catcher Velocity
The athlete's maximum throwing velocity from the catcher position in the given event year. Measured in miles per hour (MPH).
76.0
Power / Speed Score
A simple calculation that divides the athlete’s Exit Velocity Max by the athlete’s 60 Yard Dash time for the given event year. For example, 98 MPH / 7.00s = 14.00.
11.3
Hitting

2021
Exit Velocity Max
The highest exit velocity of any batted ball in the given event year. Measured in miles per hour (MPH).
86.9
Exit Velocity Avg
Average exit velocity of all batted balls in the given event year. Measured in miles per hour (MPH).
77.0
Distance Max
The highest flight distance of any batted ball in the given event year. Measured in feet (ft).
273
Distance Avg
Average flight distance of all batted balls in the given event year. Measured in feet (ft).
144
Launch Angle Avg
Average launch angle of all batted balls in the given event year. Measured in degrees.
16.7
Hard Hit %
Percentage of batted balls with exit velocities over 95 MPH in the given event year.
Sweet Spot %
Percentage of batted balls in the given event year with a launch angle between 8° and 32°.
Line Drive %
Percentage of batted balls with launch angles between 10 and 25 degrees in the given event year.
Fly Ball %
Percentage of batted balls with launch angles between 25 and 50 degrees in the given event year.
Ground Ball %
Percentage of batted balls with launch angles below 10 degrees in the given event year.
NorCal Underclass Games (Invite Only)
Sep 18, 2021
Trackman - Hitting
86.9
Exit Velocity (max)
77.0
Exit Velocity (avg)
144
Distance (avg)
273
Distance (max)
Sweet Spot %
Line Drive %
Fly Ball %
Ground Ball %
Hitting

2021
Hand Speed Max
The highest Peak Hand Speed of any swing in the given event year.
22.6
Hand Speed Avg
The average Peak Hand Speed for all swings in the given event year.
19.7
Bat Speed Max
The highest Bat Speed of any swing in the given event year.
67.0
Bat Speed Avg
The average Bat Speed for all swings in the given event year.
61.5
Rotational Acceleration Max
The highest Rotational Acceleration of any swing in the given event year.
Rotational Acceleration Avg
The average Rotational Acceleration for all swings in the given event year.
On-Plane Efficiency Max
The highest On-Plane Efficiency of any swing in the given event year.
On-Plane Efficiency Avg
The average On-Plane Efficiency for all swings in the given event year.
NorCal Underclass Games (Invite Only)
Sep 18, 2021
Blast - Hitting
22.6
Hand Speed (max)
19.7
Hand Speed (avg)
67.0
Bat Speed (max)
61.5
Bat Speed (avg)
Rot. Acc (max)
Rot. Acc (avg)
On Plane Eff (avg)
MaxOnPlaneEfficiency
Pitching

2023
2022
2021
Fastball
Velocity Max
The maximum observed fastball velocity in the given event year. Measured in miles per hour (MPH).
88.5
Fastball
Velocity Avg
The average velocity for all pitches of this type in the given event year. Measured in miles per hour (MPH).
85.6
Fastball
Spin Rate Avg
The average rate of spin for all pitches of this type in the given event year. Measured in rotations per minute (RPM).
1859
Fastball
Spin Score Avg
The average Bauer Units value of all fastballs in the given event year. Bauer Units are calculated for each pitch by dividing Spin Rate by Velocity.
21.7
Fastball
Total Movement Avg
The average total non-gravity movement for all pitches of this type in the given event year. Measured in inches (in).
Changeup
Velocity Avg
The average velocity for all pitches of this type in the given event year. Measured in miles per hour (MPH).
76.5
Changeup
Spin Rate Avg
The average rate of spin for all pitches of this type in the given event year. Measured in rotations per minute (RPM).
1066
Changeup
Total Movement Avg
The average total non-gravity movement for all pitches of this type in the given event year. Measured in inches (in).
Slider
Velocity Avg
The average velocity for all pitches of this type in the given event year. Measured in miles per hour (MPH).
72.7
Slider
Spin Rate Avg
The average rate of spin for all pitches of this type in the given event year. Measured in rotations per minute (RPM).
2101
Slider
Total Movement Avg
The average total non-gravity movement for all pitches of this type in the given event year. Measured in inches (in).
Fastball
Velocity Max
The maximum observed fastball velocity in the given event year. Measured in miles per hour (MPH).
77.6
Fastball
Velocity Avg
The average velocity for all pitches of this type in the given event year. Measured in miles per hour (MPH).
76.3
Fastball
Spin Rate Avg
The average rate of spin for all pitches of this type in the given event year. Measured in rotations per minute (RPM).
1670
Fastball
Spin Score Avg
The average Bauer Units value of all fastballs in the given event year. Bauer Units are calculated for each pitch by dividing Spin Rate by Velocity.
21.9
Fastball
Total Movement Avg
The average total non-gravity movement for all pitches of this type in the given event year. Measured in inches (in).
Slider
Velocity Avg
The average velocity for all pitches of this type in the given event year. Measured in miles per hour (MPH).
64.5
Slider
Spin Rate Avg
The average rate of spin for all pitches of this type in the given event year. Measured in rotations per minute (RPM).
1901
Slider
Total Movement Avg
The average total non-gravity movement for all pitches of this type in the given event year. Measured in inches (in).
Fastball
Velocity Max
The maximum observed fastball velocity in the given event year. Measured in miles per hour (MPH).
74.6
Fastball
Velocity Avg
The average velocity for all pitches of this type in the given event year. Measured in miles per hour (MPH).
70.6
Fastball
Spin Rate Avg
The average rate of spin for all pitches of this type in the given event year. Measured in rotations per minute (RPM).
1576
Fastball
Spin Score Avg
The average Bauer Units value of all fastballs in the given event year. Bauer Units are calculated for each pitch by dividing Spin Rate by Velocity.
22.3
Fastball
Total Movement Avg
The average total non-gravity movement for all pitches of this type in the given event year. Measured in inches (in).
Curveball
Velocity Avg
The average velocity for all pitches of this type in the given event year. Measured in miles per hour (MPH).
62.2
Curveball
Spin Rate Avg
The average rate of spin for all pitches of this type in the given event year. Measured in rotations per minute (RPM).
1848
Curveball
Total Movement Avg
The average total non-gravity movement for all pitches of this type in the given event year. Measured in inches (in).
Changeup
Velocity Avg
The average velocity for all pitches of this type in the given event year. Measured in miles per hour (MPH).
62.4
Changeup
Spin Rate Avg
The average rate of spin for all pitches of this type in the given event year. Measured in rotations per minute (RPM).
862
Changeup
Total Movement Avg
The average total non-gravity movement for all pitches of this type in the given event year. Measured in inches (in).
Slider
Velocity Avg
The average velocity for all pitches of this type in the given event year. Measured in miles per hour (MPH).
66.5
Slider
Spin Rate Avg
The average rate of spin for all pitches of this type in the given event year. Measured in rotations per minute (RPM).
2064
Slider
Total Movement Avg
The average total non-gravity movement for all pitches of this type in the given event year. Measured in inches (in).
BAWS 2023
Jun 9, 2023
Trackman - Fastball
88.5
Velocity (max)
85.1 - 87.1
Velo Range
84.1
Eff Velocity (avg)
2,074
Spin Rate (max)
1,865
Spin Rate (avg)
IVB (max)
IVB (avg)
HM (max)
HM (avg)
Extension (avg)
Release Ht (avg)
Spin Score (max)
Zone %
Spin Efficiency % (avg)
Trackman - Slider
72.3
Velocity (max)
70.4
Eff Velocity (avg)
2,337
Spin Rate (max)
2,337
Spin Rate (avg)
Extension (avg)
Release Ht (avg)
Spin Score (max)
Zone %
Spin Efficiency % (avg)
Trackman - ChangeUp
77.6
Velocity (max)
76.6 - 77.6
Velo Range
75.0
Eff Velocity (avg)
1,295
Spin Rate (max)
1,139
Spin Rate (avg)
IVB (max)
IVB (avg)
HM (max)
HM (avg)
Extension (avg)
Release Ht (avg)
Spin Score (max)
Spin Efficiency % (avg)
NorCal ProCase
Jun 4, 2023
Trackman - Fastball
86.1
Velocity (max)
83.3 - 85.5
Velo Range
82.1
Eff Velocity (avg)
1,970
Spin Rate (max)
1,844
Spin Rate (avg)
IVB (max)
IVB (avg)
HM (max)
HM (avg)
Extension (avg)
Release Ht (avg)
Spin Score (max)
Zone %
Spin Efficiency % (avg)
Trackman - Slider
75.9
Velocity (max)
71.3 - 74.3
Velo Range
70.1
Eff Velocity (avg)
2,404
Spin Rate (max)
2,062
Spin Rate (avg)
IVB (max)
IVB (avg)
HM (max)
HM (avg)
Extension (avg)
Release Ht (avg)
Spin Score (max)
Zone %
Spin Efficiency % (avg)
Trackman - ChangeUp
76.7
Velocity (max)
74.9 - 76.7
Velo Range
73.4
Eff Velocity (avg)
1,032
Spin Rate (max)
993
Spin Rate (avg)
IVB (max)
IVB (avg)
HM (max)
HM (avg)
Extension (avg)
Release Ht (avg)
Spin Score (max)
Zone %
Spin Efficiency % (avg)
NorCal Uncommitted Games
Oct 9, 2022
Trackman - Fastball
77.6
Velocity (max)
75.5 - 77.1
Velo Range
74.5
Eff Velocity (avg)
1,846
Spin Rate (max)
1,670
Spin Rate (avg)
IVB (max)
IVB (avg)
HM (max)
HM (avg)
Extension (avg)
Release Ht (avg)
Spin Score (max)
Zone %
Trackman - Slider
65.2
Velocity (max)
63.9 - 65.0
Velo Range
62.5
Eff Velocity (avg)
2,130
Spin Rate (max)
1,901
Spin Rate (avg)
IVB (max)
IVB (avg)
HM (max)
HM (avg)
Extension (avg)
Release Ht (avg)
Spin Score (max)
Zone %
NorCal Underclass Games (Invite Only)
Sep 18, 2021
Trackman - Fastball
74.6
Velocity (max)
69.3 - 71.9
Velo Range
67.7
Eff Velocity (avg)
1,740
Spin Rate (max)
1,576
Spin Rate (avg)
IVB (max)
IVB (avg)
HM (max)
HM (avg)
Extension (avg)
Release Ht (avg)
Spin Score (max)
Zone %
Trackman - Curveball
64.8
Velocity (max)
59.7 - 64.8
Velo Range
59.4
Eff Velocity (avg)
1,896
Spin Rate (max)
1,848
Spin Rate (avg)
IVB (max)
IVB (avg)
HM (max)
HM (avg)
Extension (avg)
Release Ht (avg)
Spin Score (max)
Zone %
Trackman - Slider
66.5
Velocity (max)
63.4
Eff Velocity (avg)
2,064
Spin Rate (max)
2,064
Spin Rate (avg)
IVB (max)
IVB (avg)
HM (max)
HM (avg)
Extension (avg)
Release Ht (avg)
Spin Score (max)
Zone %
Trackman - ChangeUp
63.2
Velocity (max)
61.7 - 63.1
Velo Range
59.5
Eff Velocity (avg)
930
Spin Rate (max)
862
Spin Rate (avg)
IVB (max)
IVB (avg)
HM (max)
HM (avg)
Extension (avg)
Release Ht (avg)
Spin Score (max)
Zone %
Pitch Scores
Pitching Velos
2023
2022
2021
Fastball
Velocity Max
The maximum observed fastball velocity in the given event year. Measured in miles per hour (MPH).
86.0
Fastball
Velocity Avg
The average velocity for all pitches of this type in the given event year. Measured in miles per hour (MPH)
84.0
Changeup
Velocity Avg
The average velocity for all pitches of this type in the given event year. Measured in miles per hour (MPH)
75.5
Slider
Velocity Avg
The average velocity for all pitches of this type in the given event year. Measured in miles per hour (MPH)
71.5
Fastball
Velocity Max
The maximum observed fastball velocity in the given event year. Measured in miles per hour (MPH).
79.0
Fastball
Velocity Avg
The average velocity for all pitches of this type in the given event year. Measured in miles per hour (MPH)
76.0
Changeup
Velocity Avg
The average velocity for all pitches of this type in the given event year. Measured in miles per hour (MPH)
70.5
Slider
Velocity Avg
The average velocity for all pitches of this type in the given event year. Measured in miles per hour (MPH)
65.0
Fastball
Velocity Max
The maximum observed fastball velocity in the given event year. Measured in miles per hour (MPH).
74.0
Fastball
Velocity Avg
The average velocity for all pitches of this type in the given event year. Measured in miles per hour (MPH)
70.0
Curveball
Velocity Avg
The average velocity for all pitches of this type in the given event year. Measured in miles per hour (MPH)
62.0
Changeup
Velocity Avg
The average velocity for all pitches of this type in the given event year. Measured in miles per hour (MPH)
62.5
Slider
Velocity Avg
The average velocity for all pitches of this type in the given event year. Measured in miles per hour (MPH)
66.5
Game Performance

Visual Edge

Pitch Ai

Notes
News
- 2023 Area Code Upperclass Games: Athletics Quick Hits & Superlatives - Aug 22, 2023
- 2024 Rankings Update - May 11, 2023
- NorCal Uncommitted Games: TrackMan Breaking Balls - Oct 19, 2022
- NorCal Uncommitted Games TrackMan Files: Fastball - Oct 18, 2022
- NorCal Uncommitted Games: Athletic Testing - Oct 13, 2022
- Norcal Underclass Games: Pitcher Reports (2024) - Oct 12, 2021
- Norcal Underclass Games: Catcher Reports - Oct 11, 2021
- Norcal Underclass Games: TrackMan Pitching Data - Sep 30, 2021
- Norcal Underclass Games: Blast Motion Leaderboard - Sep 27, 2021
- Norcal Underclass Games: Quick Hits - Sep 27, 2021
- Norcal Underclass Games: Pitchers' Velocities - Sep 24, 2021
- Norcal Underclass Games: Stats Leaders - Sep 23, 2021
Comments
Draft Reports
Contact
Premium Content Area
To unlock contact information, you need to purchase a ScoutPLUS subscription.
Purchase Subscription OR
Login


 Sign in to view rankings
Event: NorCal ProCase
Positional Profile: RHP
Physical: 6-foot-1, 190-pounds; wide shoulders, streamlined body, sinewy strength throughout.
Delivery: Near-submarine delivery, gets the ball out at his hip or lower. Closes off with feet to create more movement and a unique arm angle. Covers a lot of ground down the hill.
Arm Action: Low and fast, catapults arm as fast as possible to release.
FB: T86.1 mph, 83.3 - 85.5 mph range, 1844 avg spin; FB tails a lot like a sinker, and works in and out in the bottom third of the zone. An uncomfortable AB for any hitter.
SL: 71.3 - 74.3 mph, 2061 avg spin; The SL is slow off the FB but moves like crazy. Gets batters to flail or give up when placed in the other batters box. Inside to RHH is less movement and results in something like a cutter but on the outside corner, it’s essentially a frisbee.
CH: 74.9 - 76.7 mph, 993 avg spin; CH feels like it is floating and then takes a steep dive.
Event: NorCal Uncommitted Games
Body: 6-1, 180-pounds. Lean strength throughout, well-proportioned.
Delivery: Works from stretch, low slot submarine type delivery, maintains consistent body control and ability to repeat, hands start near neck/shoulder height, in-line stride direction, low lift as he starts forward while separating early to allow the arm to complete the stroke.
Arm Action: Low slot not quite getting to full submarine release, tilts upper body to help lower the arm, starts high on the backside, release height averaged 2.1.
FB: T77.6 mph, 75.5-77.1 mph range, 1846 max spin; Big horizontal movement while also getting sink that his delivery suggests, has feel for the zone (70% zone%), located on both sides.
SL: 64-65 mph, 2130 max spin; Wide sweeper with occasional late bite, release height near identical to FB release, extension also close to FB release, has ability to start it at a RHH hip and get hitters to buckle.
Positional Profile: C/P - A top performer at the event.
Body: 6-0, 155-pounds. Lean body type with sinewy and wiry strength.
Hit: RHH. Medium width feet, open stance, tall set-up, hands start head high then lower to slightly below shoulder height with medium depth load, smooth lift out to even stride. Flat swing, consistently works middle of field, balanced throughout with quiet head and barrel control, slashing type line drive swing, handsy stroke, creates leverage against stiff front side.
Power: 86.9 max exit velocity, 67 max bat speed, 22.6 max hand speed, 73.5 on-plane efficiency.
Arm: RH. C - 76 mph. Quick loose arm, accurate more often than not, game throws more impressive than workout throws, showed off outstanding back-pick skills in game as he nabbed a runner at 1st, projects to be above average arm, talented thrower.
Defense: 2.05-2.15 pop times. Light feet with agility to be well above average blocker, soft strong receiver, quiet with subtle actions and nuanced receiving skills, has energy and athleticism for the position.
Run: 7.69 runner in the 60.
Positional Profile: RHP
1 IP; F7, 2B, K, 4-3
Delivery: hands work back at front leg lift. Upper body tilts chest over toes and he sinks into a side arm to low sidearm release. Closes off front side to further add more deception.
Arm Action: RH. Sidearm to low side arm release. Fast and whippy
FB: T74, 69-71 mph. Works north to south with some arm side run. Throws from side arm slot for more horizontal run and throws one from low sub to create north to south movements. Commands the zone.
CB: 60-64 mph. Bigger break working top to bottom. More looking than swinging. Strike one pitch
SL: 66-67 mph. Swing and miss pitch. Tight and later movement. Has more of a frisbee effect.
CH: 62-63 mph. Slower version of his FB from the low side arm slot. Keeps hitters honest.