The athlete's fastest 60-yard dash time in the given event year. Measured in seconds (s)
7.05
Infield Velocity
The athlete's maximum throwing velocity from an infield position in the given event year. Measured in miles per hour (MPH).
92.0
Outfield Velocity
The athlete's maximum throwing velocity from an outfield position in the given event year. Measured in miles per hour (MPH).
92.0
Power / Speed Score
A simple calculation that divides the athlete’s Exit Velocity Max by the athlete’s 60 Yard Dash time for the given event year. For example, 98 MPH / 7.00s = 14.00.
13.0
60 Yard Dash
The athlete's fastest 60-yard dash time in the given event year. Measured in seconds (s)
7.25
Home to First
The athlete's fastest home-to-first time in the given event year. Measured from bat-on-ball to foot-on-bag, in seconds (s).
4.05
Infield Velocity
The athlete's maximum throwing velocity from an infield position in the given event year. Measured in miles per hour (MPH).
91.0
Outfield Velocity
The athlete's maximum throwing velocity from an outfield position in the given event year. Measured in miles per hour (MPH).
87.0
Power / Speed Score
A simple calculation that divides the athlete’s Exit Velocity Max by the athlete’s 60 Yard Dash time for the given event year. For example, 98 MPH / 7.00s = 14.00.
12.2
Home to First
The athlete's fastest home-to-first time in the given event year. Measured from bat-on-ball to foot-on-bag, in seconds (s).
4.77
Infield Velocity
The athlete's maximum throwing velocity from an infield position in the given event year. Measured in miles per hour (MPH).
A fastball with hop has a flat approach angle and visually jumps through the zone. When thrown up in the zone, it is more likely to generate a higher swing and miss average. Hop+ of 100 is MLB average.
Fastball
Sink+
A fastball with sink has low backspin and drops through the strike zone. When thrown down in the zone, it is more likely to generate a higher ground ball percentage and lower launch angle. Sink+ of 100 is MLB average.
Fastball
Rise+
A fastball with rise has a high percentage of backspin. When thrown up in the zone, it is more likely to generate a higher fly ball percentage. Rise+ of 100 is MLB average
Fastball
Hop+
A fastball with hop has a flat approach angle and visually jumps through the zone. When thrown up in the zone, it is more likely to generate a higher swing and miss average. Hop+ of 100 is MLB average.
Fastball
Sink+
A fastball with sink has low backspin and drops through the strike zone. When thrown down in the zone, it is more likely to generate a higher ground ball percentage and lower launch angle. Sink+ of 100 is MLB average.
Fastball
Rise+
A fastball with rise has a high percentage of backspin. When thrown up in the zone, it is more likely to generate a higher fly ball percentage. Rise+ of 100 is MLB average
The athlete's fastest 0-10-yard split time in the given event year. Measured in seconds.
1.67
30 Yard Dash
The athlete's fastest 0-30-yard split time in the given event year. Measured in seconds.
3.86
60 Yard Dash
The athlete's fastest 0-60-yard time in the given event year. Measured in seconds.
7.05
Top Speed (MPH)
The athlete's fastest split time converted to miles per hour.
RSi
The reactive strength index measurement of an athlete's explosiveness by comparing their jump height to the ground contact time in between their jumps. On a scale of 0-5.
Vertical Jump
A measure of any athlete's body strength and reach calculated from the flight time divided by the contact time.
10 Yard Dash
The athlete's fastest 0-10-yard split time in the given event year. Measured in seconds.
1.63
30 Yard Dash
The athlete's fastest 0-30-yard split time in the given event year. Measured in seconds.
3.94
60 Yard Dash
The athlete's fastest 0-60-yard time in the given event year. Measured in seconds.
7.20
Top Speed (MPH)
The athlete's fastest split time converted to miles per hour.
The highest Edge Score within the given year. Edge Score is a comprehensive score that takes the core-six visual skills into account, providing an assessment of an athlete’s overall visual ability.
Wasniewski has continued to find success at the varsity level this season. On the week, he went 6-for-9 with a home run, two doubles, eight RBIs, three runs scored and three walks. In their 12-9 win over Dundee-Crown, the Warriors were down by two in the sixth inning. Wasniewski came to the plate with two on and two out and delivered a base hit to tie the game. He came onto the mound in the game with the bases loaded and struck out the batter to get them out of the jam. He earned the win on the mound in that game, throwing 2.1 innings with five strikeouts, one walk and two hits allowed.
2/24/24
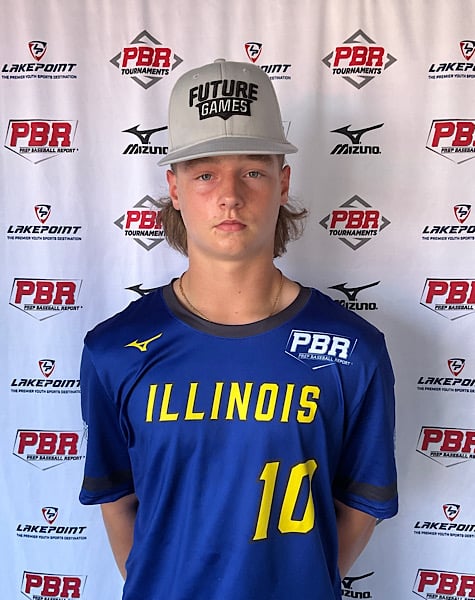
Wasniewski keeps trending up after a highly productive winter. He ran a 7.05 60, jumped 30.6 inches in the vertical, and he tied for the hardest throw across the infield of the entire event at 92 mph. On the mound, Wasniewski ran his fastball up to 90, pitching at 87-89 mph, with ride (18.3” VB) and run (18.9” HM) at peak. He also threw a tight, firm slider at 78-80 mph while also showing natural run and fade (17.1” HM avg) on a changeup at 80-82 mph.
2/24/24
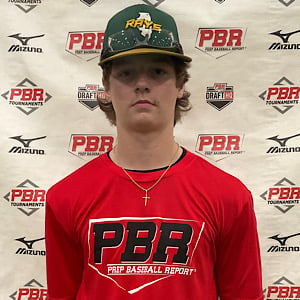
INF/RHP Kaden Wasniewski (McHenry, 2027) continues to establish himself as a legitimate two-way follow in the state. Currently ranked No. 9 in Illinois, the right-handed hitter displayed a loose swing with whippy hands through the zone, creating extension out front while maintaining balance through impact; reaching up to 90.2 mph for his max EV with a max distance of 324’. He has well above-average arm talent, reaching up to 92 mph on the infield. Wasniewski has some notable upside on the mound, listed at 6-foot, 161-pounds and equipped with obvious arm-strength, the right-hander cruised with his fastball in the 87-89 mph range, topping out at 89.8 mph with carry and heavy run to his arm-side. He showed some feel for his slider at 77-79 mph, playing with tight shape and 9/3 action, kept at the bottom of the zone. His final offering was a changeup that displayed heavy arm-side run, tumbling towards the bottom of the zone at 80-82 mph.
2/10/24
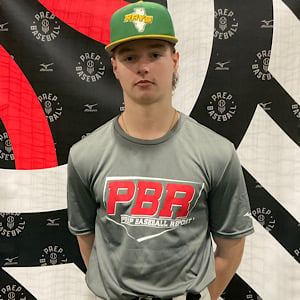
OF/RHP Kaden Wasniewski (McHenry, 2027) was far and away one of the event’s biggest winners, especially on the mound. Currently ranked No. 9 in the state, he’s added noticeable strength to his 6-foot, 160-pound frame, and there’s still much more in the tank physically. The right-hander has a simple operation with some effort through release, creating a fastball in the 87-90 mph range with carry and run through the zone, spinning consistently over 2,300 RPM. He showed feel for the zone with his changeup, playing around 79-81 mph with fading action and fastball arm-speed. His final offering was a short, 10/4 slider with late bite, 78-79 mph. He stood out on the other side of the ball as well, reaching up to 91.7 mph for his max EV with loose arms and rhythm in his hands. He looks to elevate the ball up the middle of the field, working with an uphill path that finishes with extension out front. In the outfield, Wasniewski has steady actions and hands, transitioning into a clean release with a well above-average arm (T92 mph). High-level two-way prospect to monitor moving forward.
8/08/23
One of three 2027 grads in attendance, 3B/RHP Kaden Wasniewski (McHenry) held his own against a talented and older crop of competition. The 6-foot, 155-pound right-hander pitched in the low-80s with his fastball (T2327 RPM) from a long, clean, and loose arm draw. Off that, Wasniewski spun a tight 70-72 mph slider for strikes and mixed in a changeup at 71-75 mph, too.
7/08/23
Started at third in both games for GRB on Saturday. In the first game, he flashed some power hitting a solo home run to deep left field. In the second game, he showed his power to all fields. He hit an opposite field double over the right fielder's head in the first, crushed a line-drive single into center, pulled a hard-hit single into left and finally in his last at bat he hit his second home run of the day to left field. On the mound, Wasniewski showed a clean arm with projection.
4/05/23
OF/RHP Kaden Wasniewski (McHenry, 2027) continued to impress once again with a well-above average skill set. Ran a 7.25 60, showed advanced bat speed at the plate and clean outfield actions with a big arm that topped at 87 mph. The former Junior Future Gamer, has also shown well on the mound this winter.
4/05/23
Positional Profile: 3B/RHP Body: 5-11, 154-pounds. Lean frame with room to fill out. Hit: RHH. Stock setup, small leg lift, hands load back slightly, creates separation. Quick hands through the zone, uphill path with intent to lift, uses the whole field. Power: 84 max exit velocity, averaged 80.7 mph. 244’ max distance. Arm: RH. OF - 87 mph. Long, loose, quick arm, 3/4 slot. Defense: Athletic actions, confident, plays through the ball. Run: 7.25 runner in the 60.
2/11/23
INF/RHP Kaden Wasniewski (McHenry, 2027) and INF/RHP Kash VanHouten (Canton, 2027) were two of the top, two-way, prospects in attendance at the event.
Wasniewski represented Team Illinois 13U last summer at the PBR Junior Future Games and has shown growth in all areas of his game since. Wasniewski showed an uptick in bat speed and bat strength with his average bat speed ticking up six mph to 70.2 mph. He also has advanced arm strength from the outfield and infield topping at 91 mph. On the mound is where he may feature even more upside running his fastball up to 84 mph with a polished four-pitch repertoire for someone his age. He also ran the fastest 30-yard split at the event, a 4.05, reaching a max running speed of 17.6 mph.
2/11/23
Positional Profile: 3B/RHP Body: 5-11, 150-pounds. High waisted, long levers, room to fill. Hit: RHH. Balanced open setup, short stride. Athletic swing, present bat speed, on-plane and on the barrel with authority. Power: 88 max exit velocity, averaged 83.5 mph. 248’ max distance. Arm: RH. INF - 91 mph. OF - 85 mph. OF: 3/4 slot, with life. INF: Loose, quick arm, 3/4 slot. Defense: OF: Choppy feet to the ball, moves well laterally, steady hands. INF: Athletic actions, fluid, soft hands, clean transfer, moves well laterally. Run: 4.05 30-yard split.
Delivery: Stretch-only, tall and fall, repeatable delivery, works on-line and lands square. Arm Action: RH. Clean, loose, quick arm, high 3/4 slot. FB: T84, 81-83 mph. Mostly straight, plays with life out of hand. T2214, 2147 average rpm. CB: 70-71 mph. 11/5 shape, tight spin, late break. T1964, 1905 average rpm. SL: 72-73 mph. Tight, horizontal action, advanced feel and thrown aggressively. T1984, 1618 average rpm. CH: 71-74 mph. Maintains arm speed, fade action, locates to arm side. T1807, 1746 average rpm.
8/28/22
Junior Futures Games: 3B Kaden Wasniewski went 3-for-3 with two singles and a double. Joshua Morgan came up big for the team with a RBI ground-rule double the day after he hit a monster 400-foot home run.
Ending pool play 1-1-1, Illinois snuck into the Gold Bracket as the eighth seed and faced off with Team Tennessee. On the mound for Team Illinois was RHP Kaden Wasniewski, whose clutch work on the mound helped Team Illinois secure a playoff victory. Instead, Wasniewski's RBI double in the top of the eighth was enough to keep Team Illinois in the lead permanently, following Dabe's heroics in the outfield in the half-inning that followed. Wasniewski's solid performance on the mound for Team Illinois, pitching four scoreless innings and providing some clutch at-bats, helped keep Team Illinois' hopes alive within the JFG tourney.
3B Kaden Wasniewski went 2-for-3 with two singles. C Myles Broome went 2-for-3 with a triple and one RBI. CIF Elijah Lewis also went 2-for-3 with two singles and an RBI. CF Joshua Morgan hit two singles with two RBIs.
6/03/22
Wasniewski showed well for the GRB-Illinois squad at the 13U PBR at The Rock Summer Championships. At his young age, Wasniewski already has an athletic build with room to fill out the future. At the plate, Wasniewski utilized a quiet set up with loose hands to drive a hard hit ball up the middle. He is also an aggressive infielder who plays well through the baseball. Later on in the weekend, Wasniewski toed the rubber and was equally impressive. Wasniewski is a quick-armed right-hander for GRB-Illinois that we came away impressed with during the Saturday nightcap. On the mound, Wasniewski reached highs of 75 mph on a fastball that jumped out his hand. He also showed feel for a sharp, spinning breaking ball that earned many swings-and-misses.
2/12/22
Positional Profile: SS Body: 5-7, 120-pounds. Hit: RHH. Tall, open setup, long stride. Whippy swing, level path with bat-speed, ultra loose throughout. Power: 78.4 max exit velocity, averaged 74.2 mph. 213’ max distance. Arm: RH. INF - 79 mph. Quick arm, advanced arm speed for age, dynamic release, loose action out of high 3/4 slot. Defense: Quick feet working to first, gets around the baseball, average hands, clean exchange. Run: 4.77 runner home-to-first.
Positional Profile: RHP Delivery: Stretch only, starts closed off to home, high hand placement, lands squared with an athletic finish. Arm Action: RH. Short, loose arm action, high 3/4 slot. FB: T75.5, 74.4-75.5 mph. Firm four seam type, above average spin rate for age. T2031, 1922 average rpm. CB: 62.9-65.1 mph. 11/5 vertical plane, gradual break. T1750, 1710 average rpm. CH: 65.2-66.3 mph. Late sinking action. T1593, 1494 average rpm.
2/12/22
Arguably, the top 2027 prospect in attendance looked to be Kaden Wasniewski (McHenry). Wasniewski showed an advanced tool set and ability across the board. On the mound, the right-handed pitcher opened eyes, thanks to a live, quick arm and advanced velocity for his age; fastball jumped out of the hand and sat at 74-76 mph. He also flashed a sharp, tight breaking ball and advanced changeup with sinking action. Offensively, he also impressed. He utilizes his levers in his right-handed swing, creating whip and bat speed for his age; he gets extension through contact and works gap-to-gap throughout his round.
Draft Reports
Contact
Premium Content Area
To unlock contact information, you need to purchase a ScoutPLUS subscription.
Grip strength is a measure of a players bat control and ability to transfer power and speed during impact, measured in pounds of force generated; collected with elbow bent at 90 degrees.
Grip Strgth (RH)
Grip strength is a measure of a players bat control and ability to transfer power and speed during impact, measured in pounds of force generated; collected with elbow bent at 90 degrees.


 Sign in to view rankings
Wasniewski keeps trending up after a highly productive winter. He ran a 7.05 60, jumped 30.6 inches in the vertical, and he tied for the hardest throw across the infield of the entire event at 92 mph. On the mound, Wasniewski ran his fastball up to 90, pitching at 87-89 mph, with ride (18.3” VB) and run (18.9” HM) at peak. He also threw a tight, firm slider at 78-80 mph while also showing natural run and fade (17.1” HM avg) on a changeup at 80-82 mph.
INF/RHP Kaden Wasniewski (McHenry, 2027) continues to establish himself as a legitimate two-way follow in the state. Currently ranked No. 9 in Illinois, the right-handed hitter displayed a loose swing with whippy hands through the zone, creating extension out front while maintaining balance through impact; reaching up to 90.2 mph for his max EV with a max distance of 324’. He has well above-average arm talent, reaching up to 92 mph on the infield. Wasniewski has some notable upside on the mound, listed at 6-foot, 161-pounds and equipped with obvious arm-strength, the right-hander cruised with his fastball in the 87-89 mph range, topping out at 89.8 mph with carry and heavy run to his arm-side. He showed some feel for his slider at 77-79 mph, playing with tight shape and 9/3 action, kept at the bottom of the zone. His final offering was a changeup that displayed heavy arm-side run, tumbling towards the bottom of the zone at 80-82 mph.
OF/RHP Kaden Wasniewski (McHenry, 2027) was far and away one of the event’s biggest winners, especially on the mound. Currently ranked No. 9 in the state, he’s added noticeable strength to his 6-foot, 160-pound frame, and there’s still much more in the tank physically. The right-hander has a simple operation with some effort through release, creating a fastball in the 87-90 mph range with carry and run through the zone, spinning consistently over 2,300 RPM. He showed feel for the zone with his changeup, playing around 79-81 mph with fading action and fastball arm-speed. His final offering was a short, 10/4 slider with late bite, 78-79 mph. He stood out on the other side of the ball as well, reaching up to 91.7 mph for his max EV with loose arms and rhythm in his hands. He looks to elevate the ball up the middle of the field, working with an uphill path that finishes with extension out front. In the outfield, Wasniewski has steady actions and hands, transitioning into a clean release with a well above-average arm (T92 mph). High-level two-way prospect to monitor moving forward.
One of three 2027 grads in attendance, 3B/RHP Kaden Wasniewski (McHenry) held his own against a talented and older crop of competition. The 6-foot, 155-pound right-hander pitched in the low-80s with his fastball (T2327 RPM) from a long, clean, and loose arm draw. Off that, Wasniewski spun a tight 70-72 mph slider for strikes and mixed in a changeup at 71-75 mph, too.
One of three 2027 grads in attendance, 3B/RHP Kaden Wasniewski (McHenry) held his own against a talented and older crop of competition. The 6-foot, 155-pound right-hander pitched in the low-80s with his fastball (T2327 RPM) from a long, clean, and loose arm draw. Off that, Wasniewski spun a tight 70-72 mph slider for strikes and mixed in a changeup at 71-75 mph, too.
Started at third in both games for GRB on Saturday. In the first game, he flashed some power hitting a solo home run to deep left field. In the second game, he showed his power to all fields. He hit an opposite field double over the right fielder's head in the first, crushed a line-drive single into center, pulled a hard-hit single into left and finally in his last at bat he hit his second home run of the day to left field. On the mound, Wasniewski showed a clean arm with projection.
OF/RHP Kaden Wasniewski (McHenry, 2027) continued to impress once again with a well-above average skill set. Ran a 7.25 60, showed advanced bat speed at the plate and clean outfield actions with a big arm that topped at 87 mph. The former Junior Future Gamer, has also shown well on the mound this winter.
Positional Profile: 3B/RHP
Body: 5-11, 154-pounds. Lean frame with room to fill out.
Hit: RHH. Stock setup, small leg lift, hands load back slightly, creates separation. Quick hands through the zone, uphill path with intent to lift, uses the whole field.
Power: 84 max exit velocity, averaged 80.7 mph. 244’ max distance.
Arm: RH. OF - 87 mph. Long, loose, quick arm, 3/4 slot.
Defense: Athletic actions, confident, plays through the ball.
Run: 7.25 runner in the 60.
INF/RHP Kaden Wasniewski (McHenry, 2027) and INF/RHP Kash VanHouten (Canton, 2027) were two of the top, two-way, prospects in attendance at the event.
Wasniewski represented Team Illinois 13U last summer at the PBR Junior Future Games and has shown growth in all areas of his game since. Wasniewski showed an uptick in bat speed and bat strength with his average bat speed ticking up six mph to 70.2 mph. He also has advanced arm strength from the outfield and infield topping at 91 mph. On the mound is where he may feature even more upside running his fastball up to 84 mph with a polished four-pitch repertoire for someone his age. He also ran the fastest 30-yard split at the event, a 4.05, reaching a max running speed of 17.6 mph.
Positional Profile: 3B/RHP
Body: 5-11, 150-pounds. High waisted, long levers, room to fill.
Hit: RHH. Balanced open setup, short stride. Athletic swing, present bat speed, on-plane and on the barrel with authority.
Power: 88 max exit velocity, averaged 83.5 mph. 248’ max distance.
Arm: RH. INF - 91 mph. OF - 85 mph. OF: 3/4 slot, with life. INF: Loose, quick arm, 3/4 slot.
Defense: OF: Choppy feet to the ball, moves well laterally, steady hands. INF: Athletic actions, fluid, soft hands, clean transfer, moves well laterally.
Run: 4.05 30-yard split.
Delivery: Stretch-only, tall and fall, repeatable delivery, works on-line and lands square.
Arm Action: RH. Clean, loose, quick arm, high 3/4 slot.
FB: T84, 81-83 mph. Mostly straight, plays with life out of hand. T2214, 2147 average rpm.
CB: 70-71 mph. 11/5 shape, tight spin, late break. T1964, 1905 average rpm.
SL: 72-73 mph. Tight, horizontal action, advanced feel and thrown aggressively. T1984, 1618 average rpm.
CH: 71-74 mph. Maintains arm speed, fade action, locates to arm side. T1807, 1746 average rpm.
Junior Futures Games: 3B Kaden Wasniewski went 3-for-3 with two singles and a double. Joshua Morgan came up big for the team with a RBI ground-rule double the day after he hit a monster 400-foot home run.
Ending pool play 1-1-1, Illinois snuck into the Gold Bracket as the eighth seed and faced off with Team Tennessee. On the mound for Team Illinois was RHP Kaden Wasniewski, whose clutch work on the mound helped Team Illinois secure a playoff victory. Instead, Wasniewski's RBI double in the top of the eighth was enough to keep Team Illinois in the lead permanently, following Dabe's heroics in the outfield in the half-inning that followed. Wasniewski's solid performance on the mound for Team Illinois, pitching four scoreless innings and providing some clutch at-bats, helped keep Team Illinois' hopes alive within the JFG tourney.
3B Kaden Wasniewski went 2-for-3 with two singles. C Myles Broome went 2-for-3 with a triple and one RBI. CIF Elijah Lewis also went 2-for-3 with two singles and an RBI. CF Joshua Morgan hit two singles with two RBIs.
Wasniewski showed well for the GRB-Illinois squad at the 13U PBR at The Rock Summer Championships. At his young age, Wasniewski already has an athletic build with room to fill out the future. At the plate, Wasniewski utilized a quiet set up with loose hands to drive a hard hit ball up the middle. He is also an aggressive infielder who plays well through the baseball. Later on in the weekend, Wasniewski toed the rubber and was equally impressive. Wasniewski is a quick-armed right-hander for GRB-Illinois that we came away impressed with during the Saturday nightcap. On the mound, Wasniewski reached highs of 75 mph on a fastball that jumped out his hand. He also showed feel for a sharp, spinning breaking ball that earned many swings-and-misses.
Positional Profile: SS
Body: 5-7, 120-pounds.
Hit: RHH. Tall, open setup, long stride. Whippy swing, level path with bat-speed, ultra loose throughout.
Power: 78.4 max exit velocity, averaged 74.2 mph. 213’ max distance.
Arm: RH. INF - 79 mph. Quick arm, advanced arm speed for age, dynamic release, loose action out of high 3/4 slot.
Defense: Quick feet working to first, gets around the baseball, average hands, clean exchange.
Run: 4.77 runner home-to-first.
Positional Profile: RHP
Delivery: Stretch only, starts closed off to home, high hand placement, lands squared with an athletic finish.
Arm Action: RH. Short, loose arm action, high 3/4 slot.
FB: T75.5, 74.4-75.5 mph. Firm four seam type, above average spin rate for age. T2031, 1922 average rpm.
CB: 62.9-65.1 mph. 11/5 vertical plane, gradual break. T1750, 1710 average rpm.
CH: 65.2-66.3 mph. Late sinking action. T1593, 1494 average rpm.
Arguably, the top 2027 prospect in attendance looked to be Kaden Wasniewski (McHenry). Wasniewski showed an advanced tool set and ability across the board. On the mound, the right-handed pitcher opened eyes, thanks to a live, quick arm and advanced velocity for his age; fastball jumped out of the hand and sat at 74-76 mph. He also flashed a sharp, tight breaking ball and advanced changeup with sinking action. Offensively, he also impressed. He utilizes his levers in his right-handed swing, creating whip and bat speed for his age; he gets extension through contact and works gap-to-gap throughout his round.